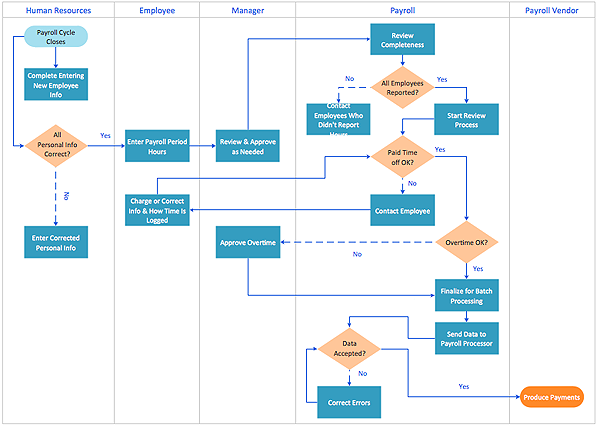
 Cross-Functional Flowcharts
Cross-functional flowcharts are powerful and useful tool for visualizing and analyzing complex business processes which requires involvement of multiple people, teams or even departments. They let clearly represent a sequence of the process steps, the order of operations, relationships between processes and responsible functional units (such as departments or positions).
HelpDesk
How to Create a Cross - Functional Flowchart Using ConceptDraw PRO
Cross-functional flowcharts are used to visualize cross-functional processes. Cross-functional process is a process that involves multiple divisions, each of which makes its part of the entire company workflow. For example: product development, lead management , client orders processing – and other critical processes. All of them are important both for business and customers, but the workflow and responsibilities distribution within these processes are divided between multiple departments and services. Cross-functional processes cannot be depicted with simple workflow diagrams, because of the specific interactions between company departments. ConceptDraw PRO has released the specialized solution to create cross-functional diagrams. Cross Functional Flowcharts solution includes a special set of templates and libraries to depict the cross-functional processes.
Cross Functional Flowchart Examples
Take a look on an example of Cross-Functional-Flowchart, showing the software service cross-function process flowcharts among the different departments. It presents a simple flowchart among the customer, sales, technical support, tester and development. Try now Flowchart Software and Cross-Functional library with 2 libraries and 45 vector shapes of the Cross-Functional Flowcharts solution. Then you can use built-in templates to create and present your software service cross-function process flowcharts.HelpDesk
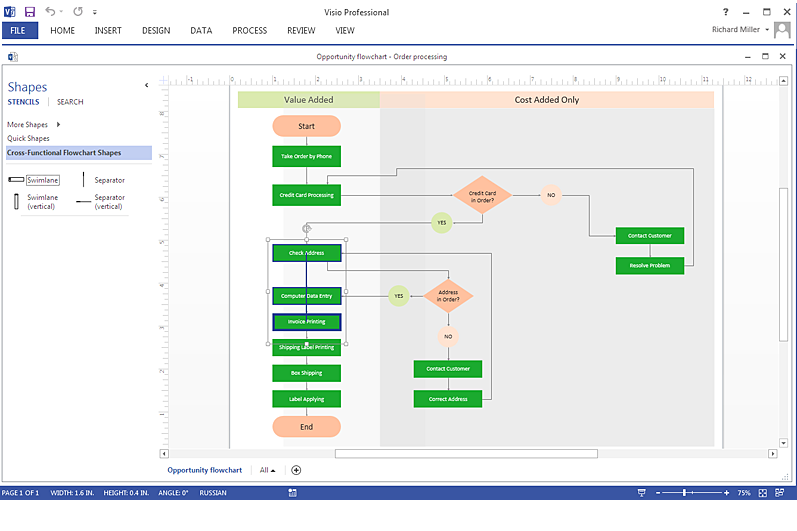
How To Create a MS Visio Cross-Functional Flowchart Using ConceptDraw PRO
Cross-functional is a process involving several functional layers. Such processes typically cause the most problems, and therefore, is the most potential for improvement. Cross-functional business processes are usually illustrate the processes of product development, commercial proposal development, the order execution process - everything, that involves several departments. The package of possible improvements - is the task of re-engineering. To illustrate the cross-functional processes often use cross-functional flowchart is often used to illustrate the cross-functional processes. ConceptDraw PRO allows you to easily create cross-functional flowchart. Then, you can export it to MS Visio VSDX or VDX format and successfully share it with your colleagues still using MS Visio.HelpDesk
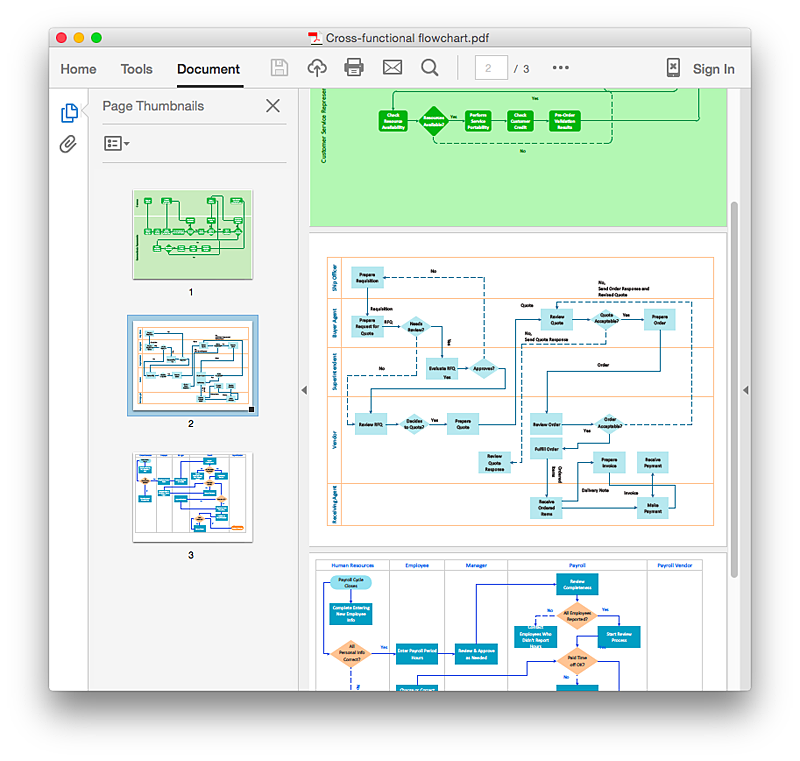
How to Add a Cross-Functional Flowchart to an Adobe PDF Using ConceptDraw PRO
ConceptDraw PRO allows you to easy share your business process documentation between different computers with different operating systems and applications using it's export capabilities. You can get your cross-functional flowcharts in pdf format and avoid any problems while communicating them.HelpDesk
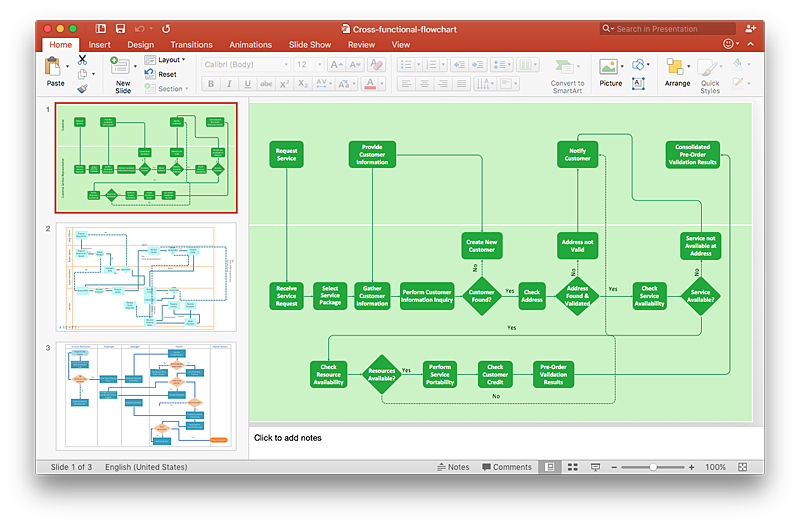
How to Add a Cross-Functional Flowchart to a PowerPoint Presentation Using ConceptDraw PRO
Using a Cross-Functional flowchart is a clear way of showing how business processes get shared or transferred between different teams and departments. ConceptDraw PRO allows you to make an MS PowerPoint Presentation from your flowcharts in a few simple steps.HelpDesk
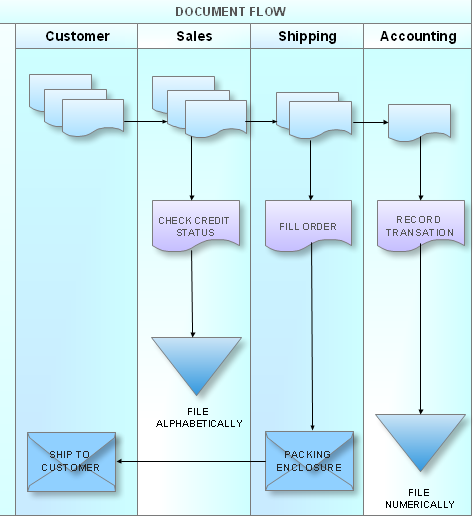
How to Use a Cross - Functional Flowcharts Solution
Cross-functional process is a process that involves multiple divisions, each of which makes its part of the entire company workflow. For example: product development, lead management , client orders processing – and other critical processes. Using a Cross-Functional flowchart is a clear way of showing each team member’s responsibilities and how processes get shared or transferred between different teams and departments.The Cross-Functional flowchart is a clear way to visualize the document flow in your organization. The ability to create Cross-functional diagrams is provided by the Cross-Functional Flowcharts solution.
- Process Flowchart | Cross - Functional Flowcharts | Flowchart ...
- How to Create a Cross - Functional Flowchart Using ConceptDraw ...
- Flow chart Example . Warehouse Flowchart | Process Flowchart ...
- Process Flowchart | Cross - Functional Flowchart | Flowchart ...
- Cross Functional Flowchart Symbols | Flow Chart Symbols | Basic ...
- Flowchart Marketing Process. Flowchart Examples | Cross ...
- Cross Functional Flowchart Symbols For Email
- Process Flowchart | Cross - Functional Flowcharts | Flowchart ...
- Flowchart Marketing Process. Flowchart Examples | Process ...
- Basic Flowchart Examples | Cross Functional Flowchart Examples ...
- Cross - Functional Flowchart | Marketing Charts | Influence Diagram ...
- Process Flowchart | ConceptDraw Solution Park | Cross - Functional ...
- Cross - Functional Flowchart | Process Flowchart | Marketing ...
- Process Flowchart | Cross - Functional Flowcharts | Basic Flowchart ...
- Flowchart Marketing Process. Flowchart Examples
- Flow chart Example . Warehouse Flowchart | Cross - Functional ...
- Example of Flowchart Diagram | Cross - Functional Flowcharts ...
- Step chart - Template | Cross - Functional Flowchart | Marketing | Step ...
- Process Flowchart | Cross Functional Flowchart Examples | Flow ...
- Marketing Diagrams | Seven Management and Planning Tools ...
