 Cross-Functional Flowcharts
Cross-functional flowcharts are powerful and useful tool for visualizing and analyzing complex business processes which requires involvement of multiple people, teams or even departments. They let clearly represent a sequence of the process steps, the order of operations, relationships between processes and responsible functional units (such as departments or positions).
Swim Lane Flowchart Symbols
Use the set of special professionally developed swim lane flowchart symbols - single, multiple, vertical and horizontal lanes from the Swimlanes and Swimlanes BPMN 1.2 libraries from the Business Process Diagram solution, the Swim Lanes library from the Business Process Mapping solution as the perfect basis for your Swim Lane Flowcharts of processes, algorithms and procedures.HelpDesk
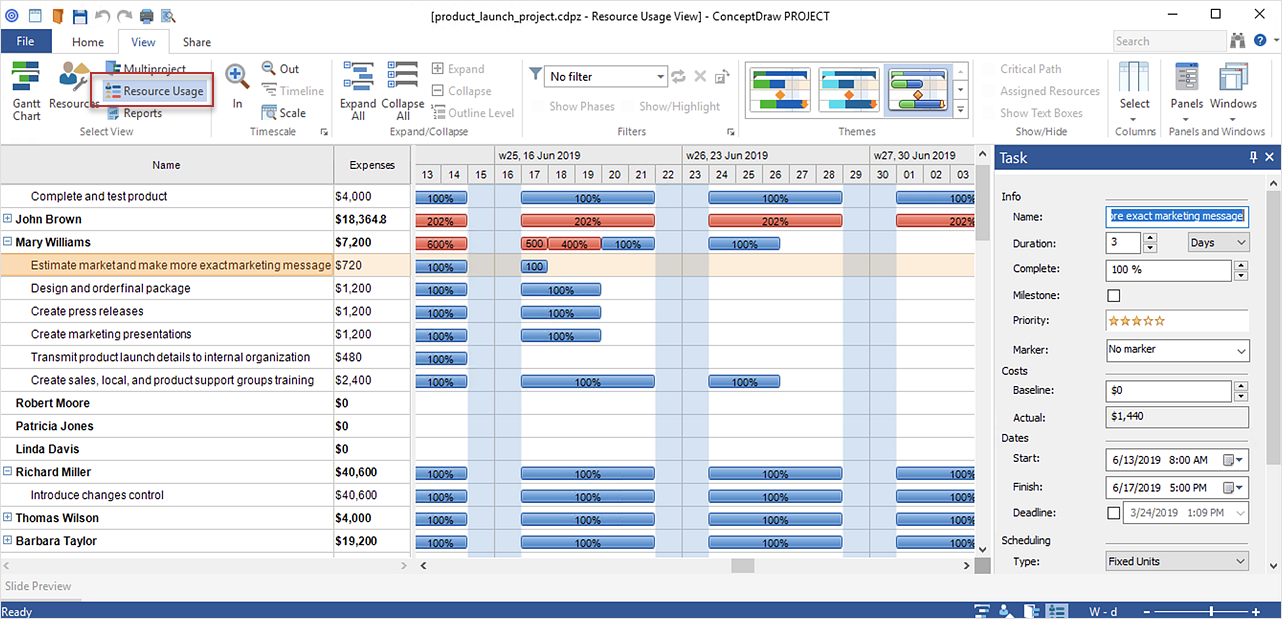
How to Plan and Allocate Resources with ConceptDraw PROJECT on PC
Effective resource management is a key factor in the successful project implementation. The common types of resources for which the project manager has an impact, include material resources (materials, energy), staff (work) and equipment. CoceptDraw PROJECT provides easy ways to project Resources Management: Create a list of project resources and assign the right human resource, as well as the necessary material, or equipment to be used.Cisco Optical. Cisco icons, shapes, stencils and symbols
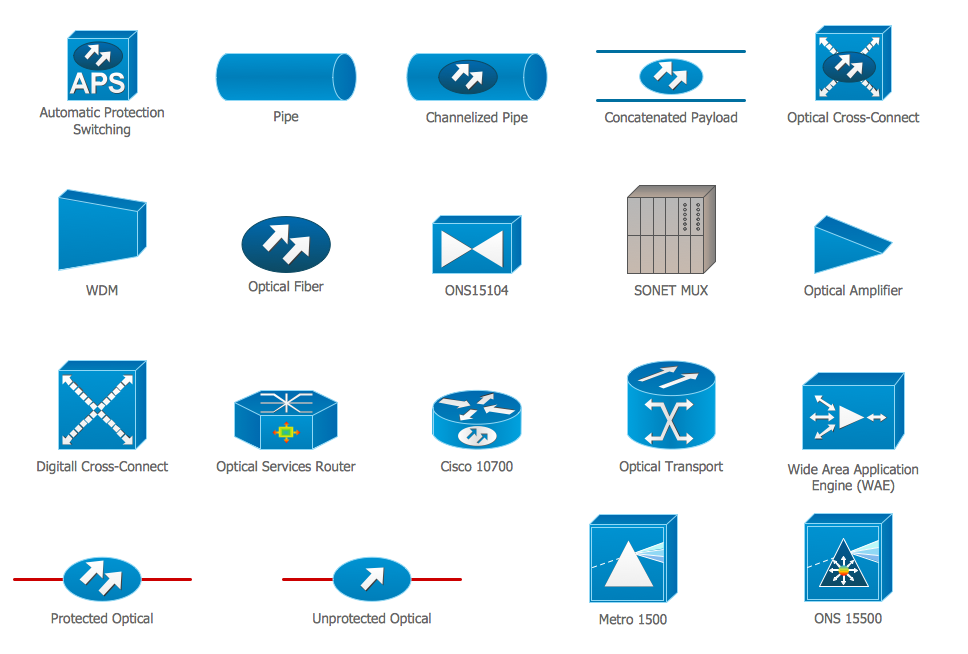
The ConceptDraw vector stencils library Cisco Optical contains symbols for drawing the computer network diagrams.Gant Chart in Project Management
Gantt Chart is a graphical representation of tasks as segments on a time scale. It helps plan and monitor project development or resource allocation. There are list of tasks, project milesones and stages. The horizontal axis is a time scale, expressed either in absolute or relative time. Gantt chart can be used for planning in virtually any industry. There are major project planning tools using gantt chart for creating project plan. For instance, using ConceptDraw PROJECT together with ConceptDraw MINDMAP for planning marketing actions is very effective way. It makes ConceptDraw Office best marketing project management software for gantt chart planning marketing message, scheduling stages when to send massive text messages or when use email marketing services in specific projects. There are simple steps on how to use project management software for marketing, sales actions and product support. This is simple all in one toolbox for managers who need best project management software for small business as for planning and brainstorming as for reporting at project execution stage. Using gantt charts together with mindmap visuals and professional presentations charts make it excellent creative project management software. ConceptDraw PROJECT is portfolio project management software it allows manage many projects with multi gantt chart.
Gantt chart examples
All Gantt charts were made using ConceptDraw PROJECT. ConceptDraw PROJECT works both on Windows and Mac OS X. It allows to schedule a voluntary number of projects in a single Workspace document and lets easily share tasks and resources among them. ConceptDraw PROJECT shares files among Windows and Mac OS X.Software development with ConceptDraw products
Internet solutions on ConceptDraw base. What may interest developers of Internet solutions.Product Overview
ConceptDraw PROJECT is a vigorous tool for managing single or multiple projects. It lets you determine all essential elements involved into project, control schedules, resources and finances, and monitor projects' progress in most effective yet simple manner.Value stream with ConceptDraw DIAGRAM
The Value stream is a totality of all actions on the projection, order composition and production: starting from creation a product project to launching this product, from order to delivery, from extraction of raw materials to ready product manufacturing. Value stream mapping is a process of visualization of these actions and creation of a detailed and graphical map.Cisco Network Icons
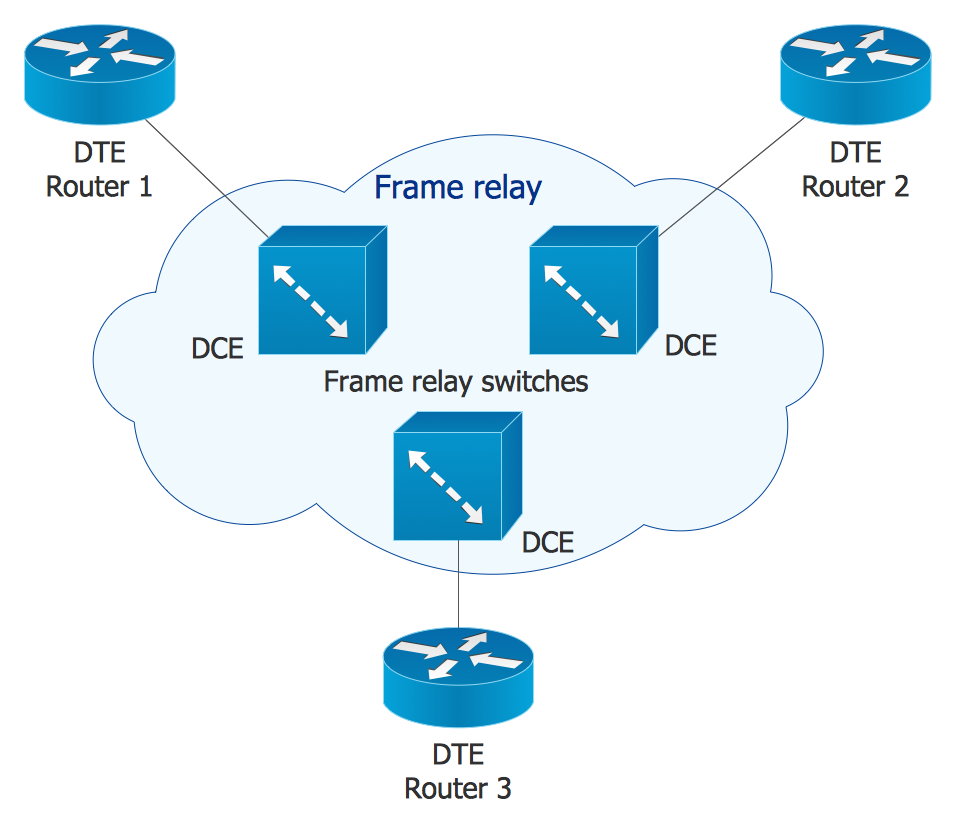
ConceptDraw DIAGRAM diagramming and vector drawing software extended with Cisco Network Diagrams Solution from the Computer and Networks Area is the best for creating Cisco Network Diagrams thanks to numerous predesigned Cisco network icons.Marketing and Sales Organization chart. Organization chart Example
The use of Organization Charts is very popular at the fields of marketing and sales. They help to depict in a visual form a lot of information about organization: the company's structure, relationships of positions within an organization in terms of authorities and responsibilities, and company's strategies. All Organizational Charts are constructed from the similar building blocks (rectangles and lines), this makes them easily for interpretation and understanding by all interested people inside and outside of this company, such as shareholders, employees, investors, distributors, suppliers, customers, etc. Organization Charts can be hand-drawn on the paper, however the preferable is to use a special software. ConceptDraw DIAGRAM diagramming and vector graphics software extended with useful Organizational Charts solution is ideal for easy representing information and data, and professional drawing Marketing and Sales Organization Chart with any depth of detailing. Organizational structure may differ during the company's development, you can design and compare the charts on each stage.Cisco Network Design. Cisco icons, shapes, stencils, symbols and design elements
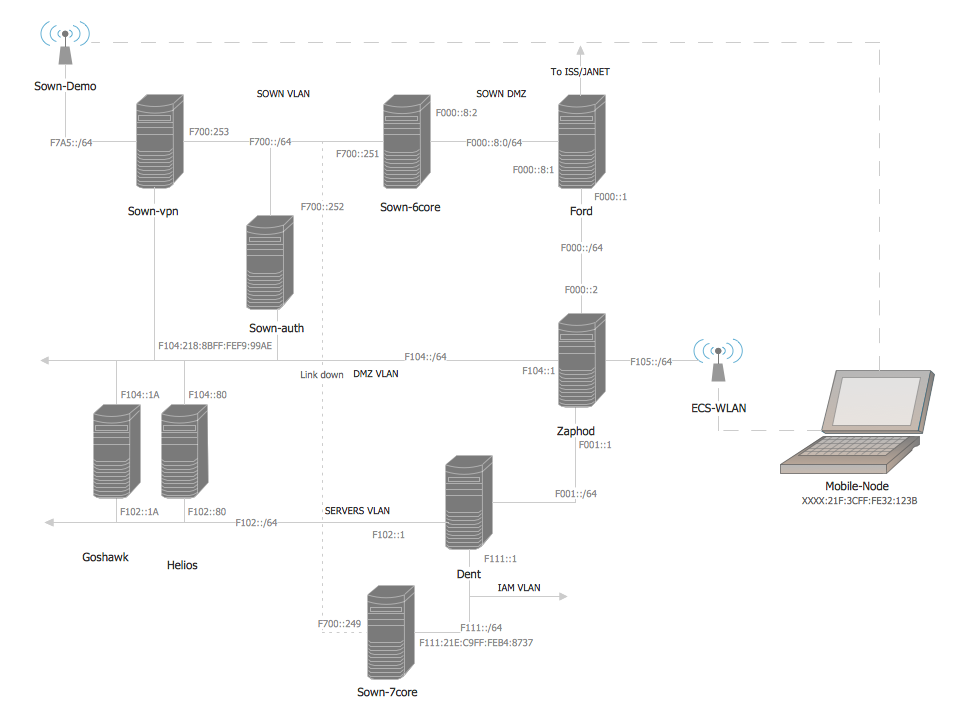
Cisco is the largest company, which specializes in the field of high technologies, develops and sells network equipment mainly for the large organizations and telecommunication companies. Cisco produces wide variety of devices and equipment, such as routers, switches, gateways, servers, network security devices (firewalls, VPN, IDs, etc.), ATM switches, cable modems and DSL equipment, access points Wi-Fi, products for IP telephony, etc. The first commercially successful multi-protocol router, which enabled for previously incompatible computers to communicate between themselves, is also developed by Cisco company. Cisco is a generally accepted standard, which uses globally recognized Cisco icons for all produced Cisco equipment. ConceptDraw DIAGRAM software extended with Cisco Network Diagrams solution from Computer and Network area contains a lot of predesigned Cisco network design elements for professional drawing Cisco network diagrams, visualization computer network topologies, equipment connections and arrangement.HelpDesk
How to Create Multple Projects Schedule on Windows
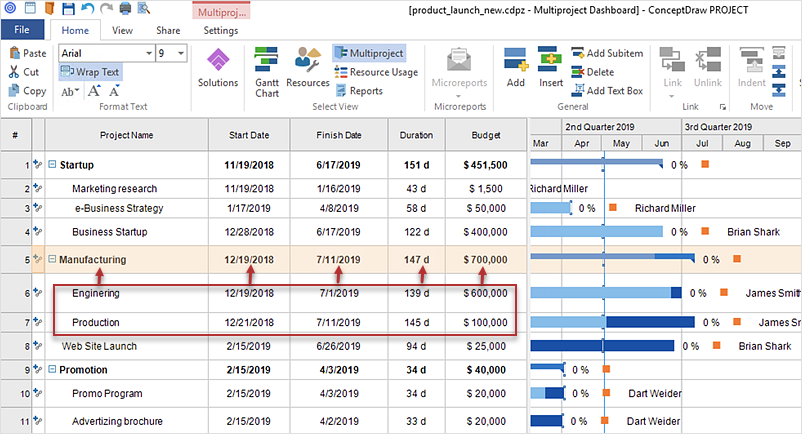
ConceptDraw PROJECT is simple project scheduling software, it allows grouping individual projects into multiple projects that can use a common resource pool and a synchronized task schedule. You can create a detailed schedule of your multiple projects quickly and easy with ConceptDraw PROJECT. When considering project change requests, a project manager can model their interaction by grouping or dividing into sub-projects. It includes useful critical path scheduling software tools. The Multiproject Dashboard mode enables planning and managing several projects simultaneously using the single resource pool for all projects. The Multiproject Dashboard mode helps you plan multiple projects while providing you with the overall view.HelpDesk
How to Operate with Project Time Frames in ConceptDraw PROJECT
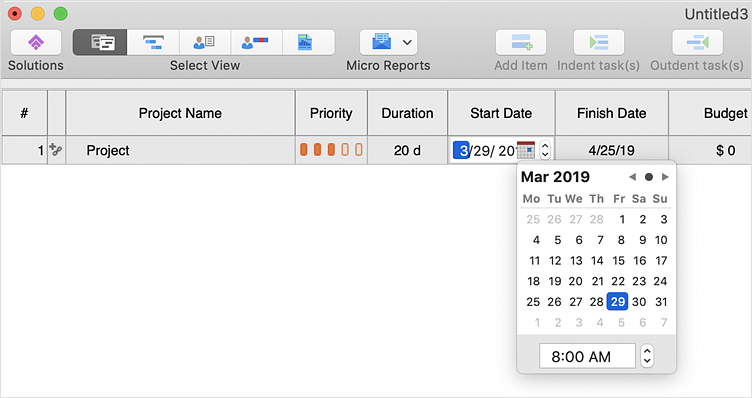
ConceptDraw PROJECT applies an advanced scheduling facilities to enable you arrange your project's tasks with existing human and material resources. Comprehension of project scheduling principle allows you to plan the project the best way to execute it. Sometimes user is wondering why the task is moved to a different time than he supposed. Or he may be confused when a task's tardiness provoke the unwanted shift of other tasks. This article describes how do changes to the Start/Finish dates, or the Duration of the task affect the project schedule, created in ConceptDraw PROJECT.Project Timeline
Project timeline is a type of chart which allows visually represent the chronology of works for the project, placing the key points of the project (milestones) on a timescale. You need to make professional looking project timeline? Create it with ConceptDraw DIAGRAM ! ConceptDraw DIAGRAM extended with Timeline Diagrams Solution from the Management Area is the best timeline diagrams software- How to Plan and Allocate Resources in Your Project with ...
- Hd Add Employee Icon Png
- Work In Progress Icon Flowchart
- How to Plan and Allocate Resources in Your Project with ...
- How to Plan and Allocate Resources in Your Project with ...
- Basic Flowchart Symbols and Meaning | Cross -Functional Flowchart ...
- Cross -Functional Flowchart | Gant Chart in Project Management ...
- Financial Report Icon
- How to Split a Complex Map to a Few Simple Maps | Cross ...
- Human Resource Planning Process Wikipedia
- Flowchart design. Flowchart symbols, shapes, stencils and icons ...
- Automation Icon
- Process Flowchart | Rack Diagrams | Cross -Functional Flowchart ...
- How to Plan and Allocate Resources in Your Project with ...
- Pyramid Diagram | Software Work Flow Process in Project ...
- Process Flowchart | Cross -Functional Flowchart | Business diagrams ...
- Process Of Human Resources Planning Wikipedia With Diagram
- Resources and energy - Vector stencils library | Design elements ...
- Account Icon
- Human Resource Development | Gant Chart in Project Management ...

