 Crystal Mapping
With Crystal Mapping all goals and relevant information can be observed in one radiant dashboard.
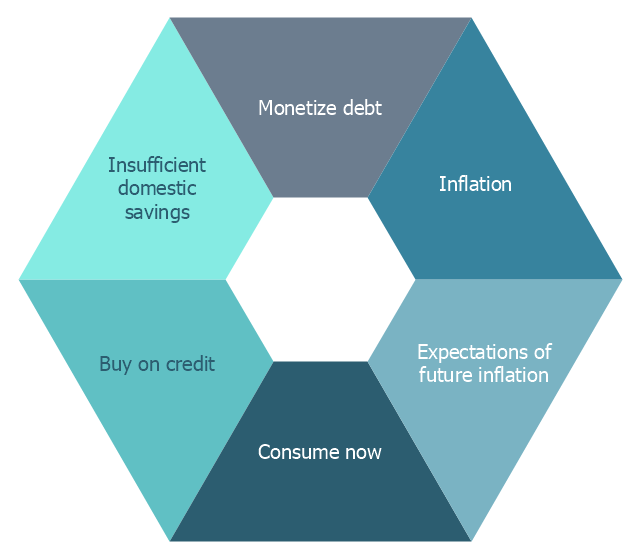
This hexagon diagram sample was redesigned from the Wikipedia file: Vicious circle in macroeconomics.svg. "An example of the use of a vicious circle in macroeconomics." [en.wikipedia.org/ wiki/ File:Vicious_ circle_ in_ macroeconomics.svg]
"A virtuous circle and a vicious circle (also referred to as virtuous cycle and vicious cycle) are economic terms. They refer to a complex chain of events that reinforces itself through a feedback loop. A virtuous circle has favorable results, while a vicious circle has detrimental results.
Both circles are complexes of events with no tendency towards equilibrium (at least in the short run). Both systems of events have feedback loops in which each iteration of the cycle reinforces the previous one (positive feedback). These cycles will continue in the direction of their momentum until an external factor intervenes and breaks the cycle. The prefix "hyper-" is sometimes used to describe these cycles if they are extreme. The best-known example of a vicious circle is hyperinflation. ...
Example in macroeconomics.
Vicious circle.
Hyperinflation is a spiral of inflation which causes even higher inflation. The initial exogenous event might be a sudden large increase in international interest rates or a massive increase in government debt due to excessive spendings. Whatever the cause, the government could pay down some of its debt by printing more money (called monetizing the debt). This increase in the money supply could increase the level of inflation. In an inflationary environment, people tend to spend their money quickly because they expect its value to decrease further in the future. They convert their financial assets into physical assets while their money still has some purchasing power. Often they will purchase on credit. Eventually, the currency loses all of its value. Because of this, the level of savings in the country is very low and the government could have problems refinancing its debt. Its solution could be to print still more money starting another iteration of the vicious cycle." [Virtuous circle and vicious circle. Wikipedia]
The crystal diagram example "Vicious circle" was created using the ConceptDraw PRO diagramming and vector drawing software extended with the Target and Circular Diagrams solution from the Marketing area of ConceptDraw Solution Park.
www.conceptdraw.com/ solution-park/ marketing-target-and-circular-diagrams
This hexagon diagram sample was redesigned from the Wikipedia file: Virtuous circle in macroeconomics.svg. "An example of the use of a virtuous circle in macroeconomics."
[en.wikipedia.org/ wiki/ File:Virtuous_ circle_ in_ macroeconomics.svg]
"A virtuous circle and a vicious circle (also referred to as virtuous cycle and vicious cycle) are economic terms. They refer to a complex chain of events that reinforces itself through a feedback loop. A virtuous circle has favorable results, while a vicious circle has detrimental results.
Both circles are complexes of events with no tendency towards equilibrium (at least in the short run). Both systems of events have feedback loops in which each iteration of the cycle reinforces the previous one (positive feedback). These cycles will continue in the direction of their momentum until an external factor intervenes and breaks the cycle. The prefix "hyper-" is sometimes used to describe these cycles if they are extreme. The best-known example of a vicious circle is hyperinflation. ...
Example in macroeconomics.
Virtuous circle.
Economic growth can be seen as a virtuous circle. It might start with an exogenous factor such as technological innovation. As people get familiar with the new technology, there could be learning curve effects and economies of scale. This could lead to reduced costs and improved production efficiencies. In a competitive market structure, this will probably result in lower average prices or a decrease in employment as it takes fewer workers to produce the same output. As prices decrease, consumption could increase and aggregate output also. Increased levels of output lead to more learning and scale effects and a new cycle starts."
[en.wikipedia.org/ wiki/ Virtuous_ circle_ and_ vicious_ circle]
The crystal diagram example "Virtuous circle (macroeconomics)" was created using the ConceptDraw PRO diagramming and vector drawing software extended with the Target and Circular Diagrams solution from the Marketing area of ConceptDraw Solution Park.
www.conceptdraw.com/ solution-park/ marketing-target-and-circular-diagrams
The vector stencils library "Circular diagrams" contains 42 templates of circular diagrams: circular arrow diagram, circular motion diagram, arrow ring chart, doughnut chart (donut chart), circle pie chart, diamond pie chart, circle diagram, pie chart, ring chart, loop diagram, block loop diagram, arrow loop circle, crystal diagram, triangular diagram, diamond diagram, pentagon diagram, hexagon diagram, heptagon diagram, cycle diagram (cycle chart), stacked Venn diagram (onion diagram), arrow circle diagram.
Use these shapes to illustrate your marketing and sales documents, presentations, webpages and infographics in the ConceptDraw PRO diagramming and vector drawing software extended with the Target and Circular Diagrams solution from the Marketing area of ConceptDraw Solution Park.
www.conceptdraw.com/ solution-park/ marketing-target-and-circular-diagrams
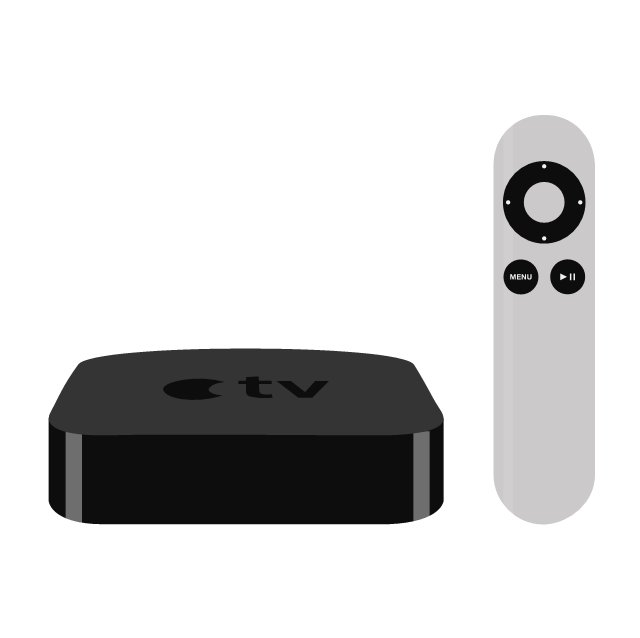
The vector stencils library "Video and TV" contains 24 clipart images of video and TV devices and digital gadgets.
Use these shapes for drawing illustrations of home and office video and TV systems, home entertainment systems, closed-circuit television (CCTV) surveillance systems.
"Video is an electronic medium for the recording, copying and broadcasting of moving visual images." [Video. Wikipedia]
"Digital video is a type of digital recording system that works by using a digital rather than an analog video signal.
The terms camera, video camera, and camcorder are used interchangeably in this article." [Digital video. Wikipedia]
"Digital television (DTV) is the transmission of audio and video by digitally processed and multiplexed signal, in contrast to the totally analog and channel separated signals used by analog television." [Digital television. Wikipedia]
The clip art example "Video and TV - Vector stencils library" was created using the ConceptDraw PRO diagramming and vector drawing software extended with the Audio, Video, Media solution from the Illustration area of ConceptDraw Solution Park.
www.conceptdraw.com/ solution-park/ illustrations-audio-video-media
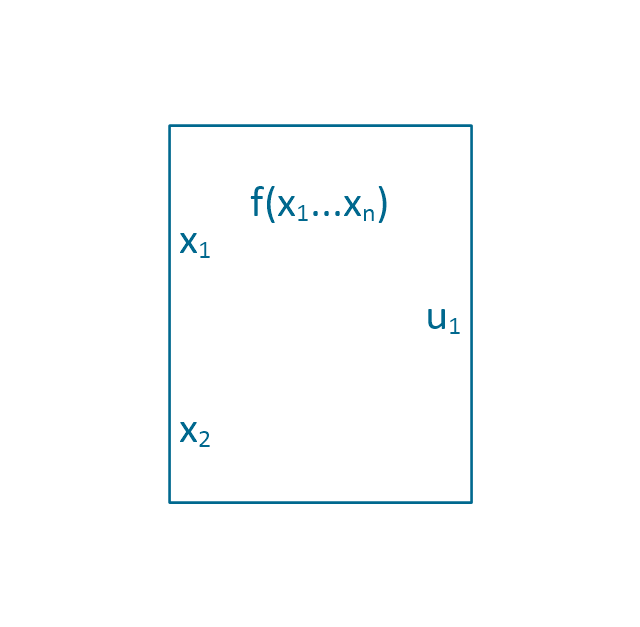
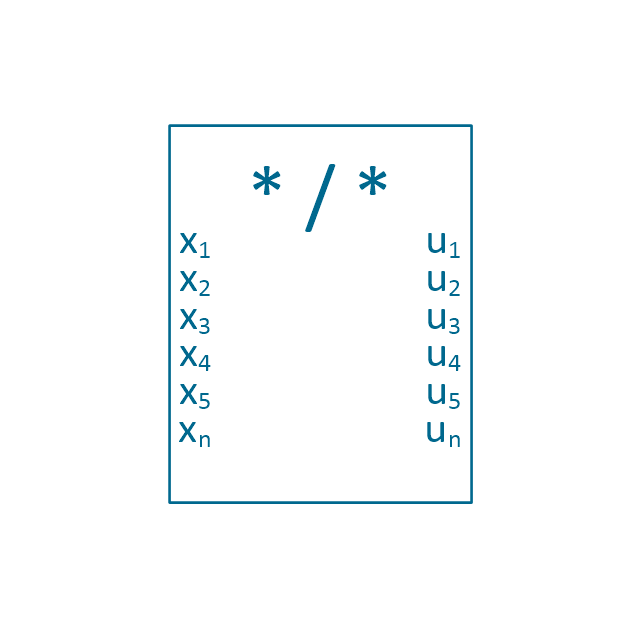
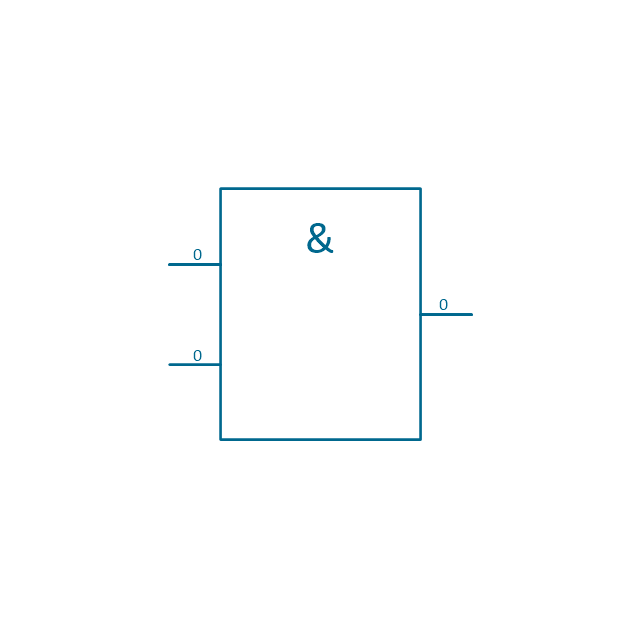
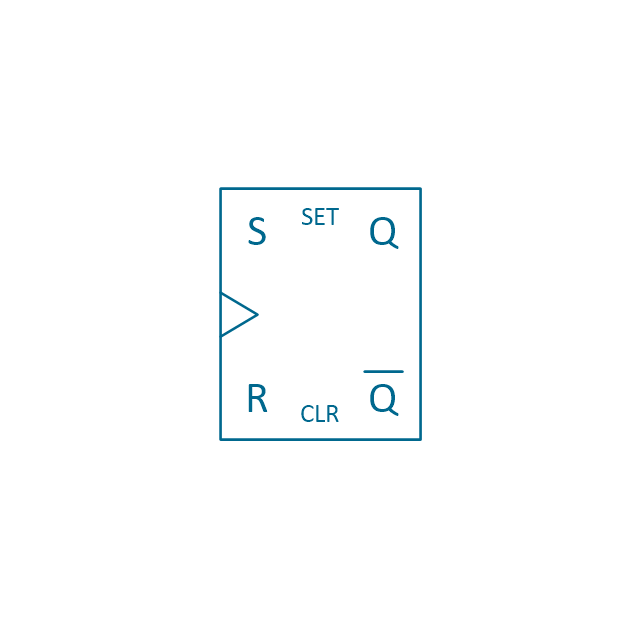
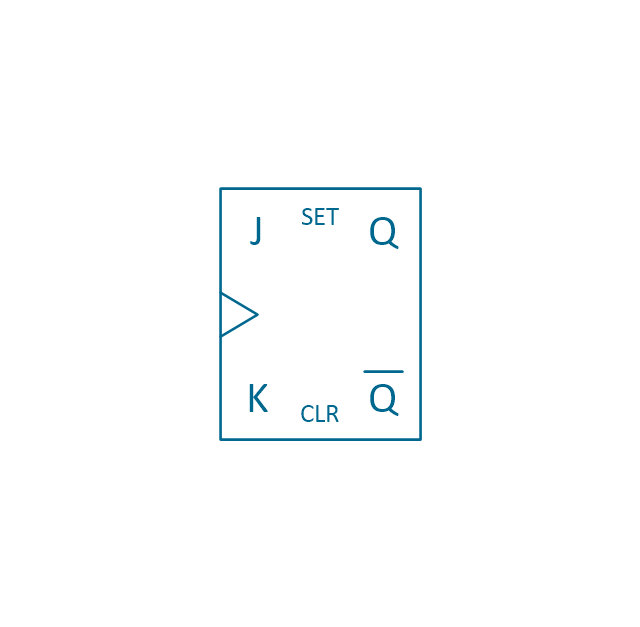
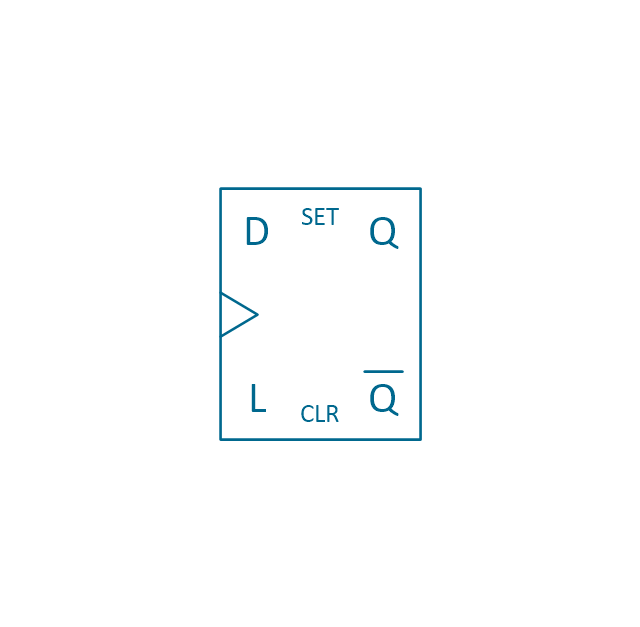
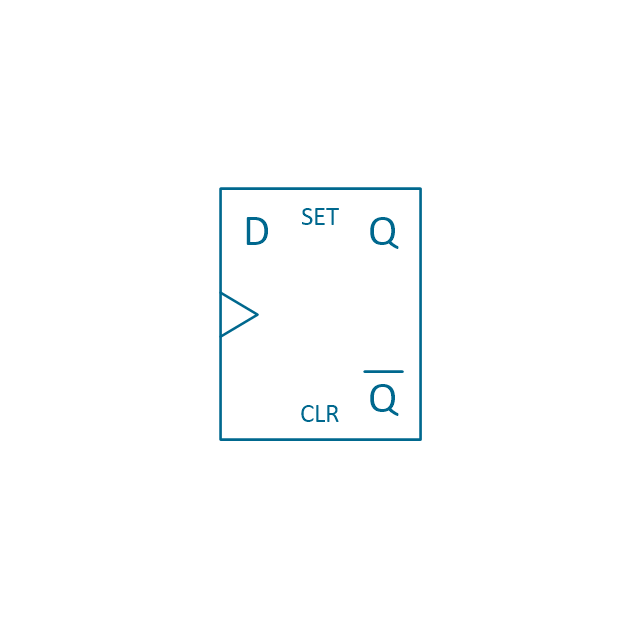
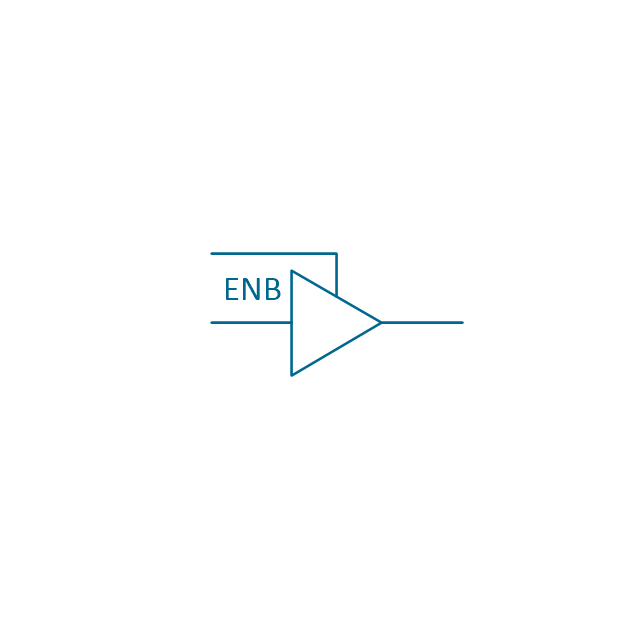
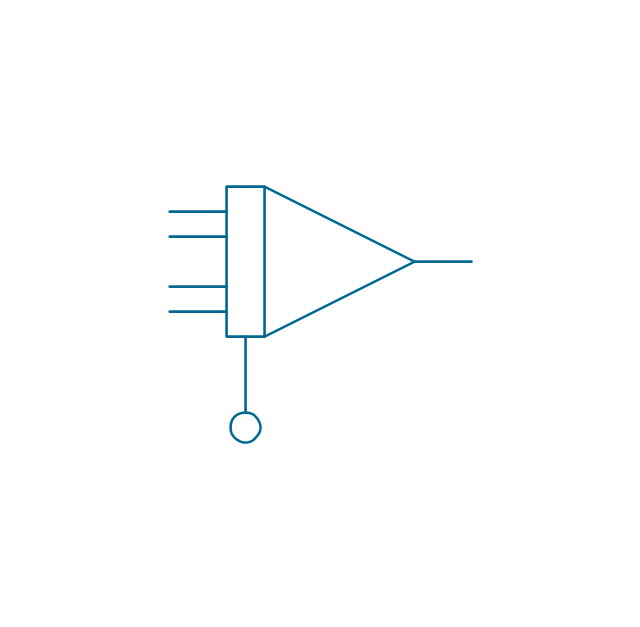
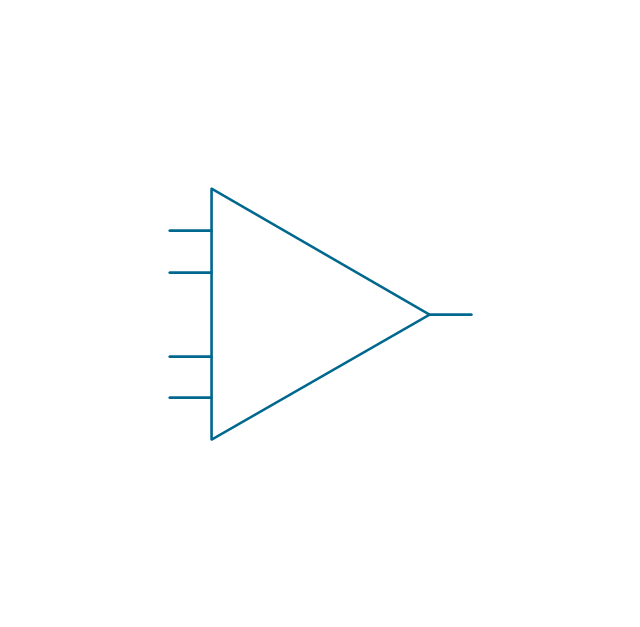
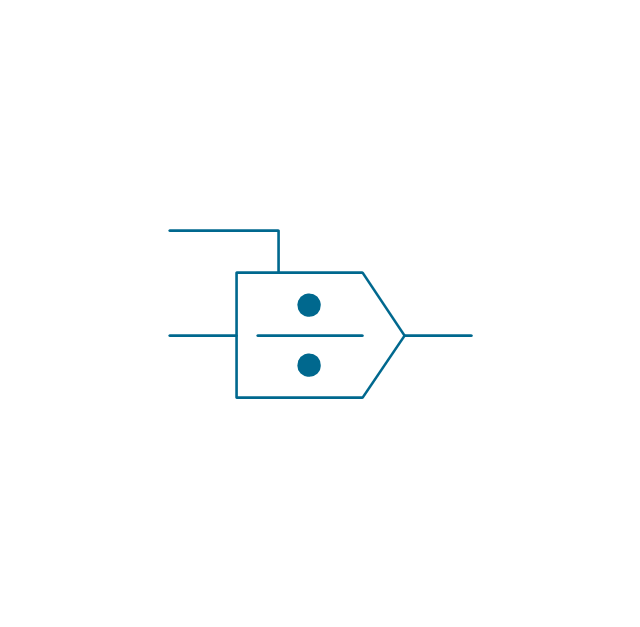
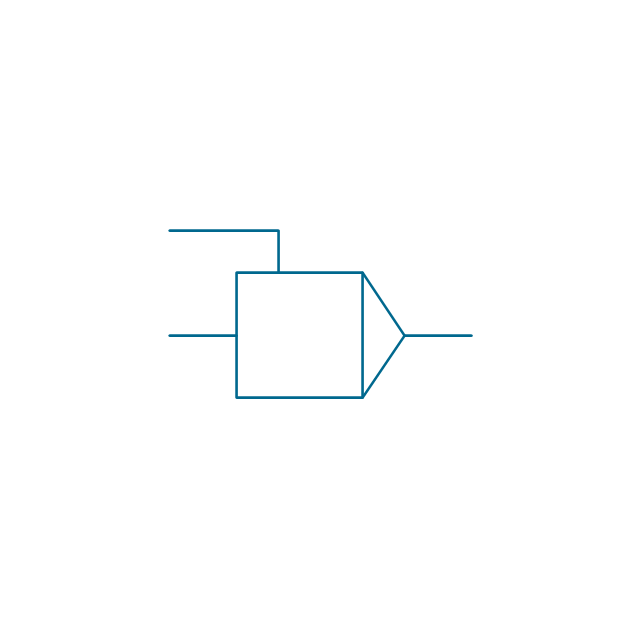
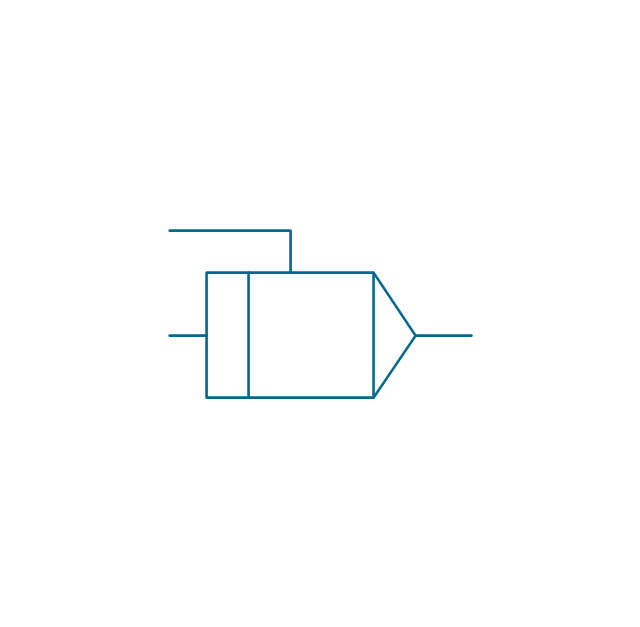
The vector stencils library "Analog and digital logic" contains 40 element symbols of logic (threshold) gates, bistable current switches, current controllers, regulators, electrical generators, and amplifiers.
Use it for drawing the digital and analog functions in electronic circuit diagrams and electrical schematics in the ConceptDraw PRO diagramming and vector drawing software extended with the Electrical Engineering solution from the Engineering area of ConceptDraw Solution Park.
www.conceptdraw.com/ solution-park/ engineering-electrical
The vector stencils library "Weather" contains 17 weather clipart images for drawing illustrations on climate to show cloudiness, air temperature, precipitation, wind.
"Weather is the state of the atmosphere, to the degree that it is hot or cold, wet or dry, calm or stormy, clear or cloudy. Most weather phenomena occur in the troposphere, just below the stratosphere. Weather generally refers to day-to-day temperature and precipitation activity, whereas climate is the term for the average atmospheric conditions over longer periods of time. When used without qualification, "weather", is generally understood to mean the weather of Earth.
Weather is driven by air pressure (temperature and moisture) differences between one place and another. These pressure and temperature differences can occur due to the sun angle at any particular spot, which varies by latitude from the tropics. The strong temperature contrast between polar and tropical air gives rise to the jet stream. Weather systems in the mid-latitudes, such as extratropical cyclones, are caused by instabilities of the jet stream flow. Because the Earth's axis is tilted relative to its orbital plane, sunlight is incident at different angles at different times of the year. On Earth's surface, temperatures usually range ±40°C (−40°F to 100°F) annually. Over thousands of years, changes in Earth's orbit affect the amount and distribution of solar energy received by the Earth and influence long-term climate and global climate change." [Weather. Wikipedia]
The clip art example "Weather - Vector stencils library" was created using the ConceptDraw PRO diagramming and vector drawing software extended with the Nature solution from the Illustration area of ConceptDraw Solution Park.
www.conceptdraw.com/ solution-park/ illustrations-nature
The vector stencils library "Marketing" contains 43 clipart images for drawing marketing illustrations.
"Marketing is the process of communicating the value of a product or service to customers, for the purpose of selling that product or service.
Marketing can be looked at as an organizational function and a set of processes for creating, delivering and communicating value to customers, and managing customer relationships in ways that also benefit the organization. Marketing is the science of choosing target markets through market analysis and market segmentation, as well as understanding consumer buying behavior and providing superior customer value. From a societal point of view, marketing is the link between a society’s material requirements and its economic patterns of response. Marketing satisfies these needs and wants through exchange processes and building long term relationships.
Organizations may choose to operate a business under five competing concepts: the production concept, the product concept, the selling concept, the marketing concept, and the holistic marketing concept. The four components of holistic marketing are relationship marketing, internal marketing, integrated marketing, and socially responsive marketing. The set of engagements necessary for successful marketing management includes capturing marketing insights, connecting with customers, building strong brands, shaping the market offerings, delivering and communicating value, creating long-term growth, and developing marketing strategies and plans." [Marketing. Wikipedia]
The clip art example "Marketing - Vector stencils library" was created using the ConceptDraw PRO software extended with the Business and Finance solution from the Illustration area of ConceptDraw Solution Park.
www.conceptdraw.com/ solution-park/ illustrations-business-finance
The vector stencils library "Video and TV" contains 24 clipart images of video and TV devices and digital gadgets.
Use these shapes for drawing illustrations of home and office video and TV systems, home entertainment systems, closed-circuit television (CCTV) surveillance systems.
"Video is an electronic medium for the recording, copying and broadcasting of moving visual images." [Video. Wikipedia]
"Digital video is a type of digital recording system that works by using a digital rather than an analog video signal.
The terms camera, video camera, and camcorder are used interchangeably in this article." [Digital video. Wikipedia]
"Digital television (DTV) is the transmission of audio and video by digitally processed and multiplexed signal, in contrast to the totally analog and channel separated signals used by analog television." [Digital television. Wikipedia]
The clip art example "Video and TV - Vector stencils library" was created using the ConceptDraw PRO diagramming and vector drawing software extended with the Audio, Video, Media solution from the Illustration area of ConceptDraw Solution Park.
www.conceptdraw.com/ solution-park/ illustrations-audio-video-media
Use these shapes for drawing illustrations of home and office video and TV systems, home entertainment systems, closed-circuit television (CCTV) surveillance systems.
"Video is an electronic medium for the recording, copying and broadcasting of moving visual images." [Video. Wikipedia]
"Digital video is a type of digital recording system that works by using a digital rather than an analog video signal.
The terms camera, video camera, and camcorder are used interchangeably in this article." [Digital video. Wikipedia]
"Digital television (DTV) is the transmission of audio and video by digitally processed and multiplexed signal, in contrast to the totally analog and channel separated signals used by analog television." [Digital television. Wikipedia]
The clip art example "Video and TV - Vector stencils library" was created using the ConceptDraw PRO diagramming and vector drawing software extended with the Audio, Video, Media solution from the Illustration area of ConceptDraw Solution Park.
www.conceptdraw.com/ solution-park/ illustrations-audio-video-media
The vector stencils library "Analog and digital logic" contains 40 element symbols of logic (threshold) gates, bistable current switches, current controllers, regulators, electrical generators, and amplifiers.
Use it for drawing the digital and analog functions in electronic circuit diagrams and electrical schematics in the ConceptDraw PRO diagramming and vector drawing software extended with the Electrical Engineering solution from the Engineering area of ConceptDraw Solution Park.
www.conceptdraw.com/ solution-park/ engineering-electrical
Use it for drawing the digital and analog functions in electronic circuit diagrams and electrical schematics in the ConceptDraw PRO diagramming and vector drawing software extended with the Electrical Engineering solution from the Engineering area of ConceptDraw Solution Park.
www.conceptdraw.com/ solution-park/ engineering-electrical
 Fishbone Diagram
Fishbone Diagrams solution extends ConceptDraw PRO software with templates, samples and library of vector stencils for drawing the Ishikawa diagrams for cause and effect analysis.
- Crystal Mapping | Business Productivity Area | Value Stream ...
- Vicious circle - Crystal diagram
- Crystal Mapping | PM Easy | ConceptDraw Solution Park | Swot ...
- Crystal Mapping | Business Productivity Area | Maps | Crystal Map
- Value Stream Mapping | Fishbone Diagram | Crystal Mapping | Swot ...
- PM Personal Time Management | Crystal Mapping | Management ...
- Crystal Mapping | Modele Uml
- Flowchart Software | Crystal Mapping | Azure Storage | Visio Premium
- UML Class Diagram Tutorial | Crystal Mapping | Fishbone Diagram ...
- Remote Projects in Corporate Strategy | Business Productivity Area ...
- Crystal diagram - 4 elements
- Basic Flowchart Symbols and Meaning | Vicious circle - Crystal ...
- Video and TV - Vector stencils library
- Types of Flowcharts | Material Requisition Flowchart. Flowchart ...
- Entity-Relationship Diagram (ERD) | ConceptDraw PRO ER ...
- How to Edit a Project Task List | Crystal Mapping | How to Connect ...
- Analog and digital logic - Vector stencils library
- Analog and digital logic - Vector stencils library
- Analog and digital logic - Vector stencils library
- Crystal Mapping | ConceptDraw Solution Park | Visio 2013 Premium
---crystal-diagram.png--diagram-flowchart-example.png)


