 Divided Bar Diagrams
The Divided Bar Diagrams Solution extends the capabilities of ConceptDraw PRO v10 with templates, samples, and a library of vector stencils for drawing high impact and professional Divided Bar Diagrams and Graphs, Bar Diagram Math, and Stacked Graph.
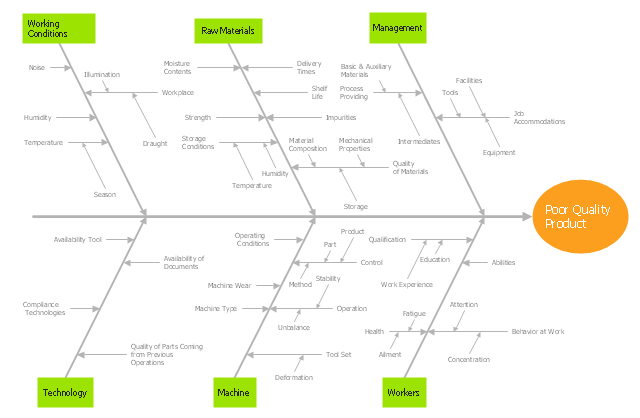
"Ishikawa diagrams (also called fishbone diagrams, herringbone diagrams, cause-and-effect diagrams, or Fishikawa) are causal diagrams created by Kaoru Ishikawa (1968) that show the causes of a specific event. Common uses of the Ishikawa diagram are product design and quality defect prevention, to identify potential factors causing an overall effect. Each cause or reason for imperfection is a source of variation. Causes are usually grouped into major categories to identify these sources of variation. The categories typically include:
- People: Anyone involved with the process
- Methods: How the process is performed and the specific requirements for doing it, such as policies, procedures, rules, regulations and laws
- Machines: Any equipment, computers, tools, etc. required to accomplish the job
- Materials: Raw materials, parts, pens, paper, etc. used to produce the final product
- Measurements: Data generated from the process that are used to evaluate its quality
- Environment: The conditions, such as location, time, temperature, and culture in which the process operates" [Ishikawa diagram. Wikipedia]
The fishbone diagram example "Causes of low-quality output" was created using the ConceptDraw PRO diagramming and vector drawing software extended with the Fishbone Diagrams solution from the Management area of ConceptDraw Solution Park.
- Pyramid Diagram | Organizational culture - Triangle diagram ...
- Matrix Organization Structure | Process Flowchart | Pyramid Diagram ...
- Pyramid Diagram | Building Drawing Software for Design Site Plan ...
- Company Culture Symbol
- Pyramid Diagram | Organizational culture - Triangle diagram ...
- Organizational culture - Triangle diagram | Pyramid Diagram | Matrix ...
- Onion Diagram Process Design | Stakeholder Onion Diagram ...
- Matrix Organization Structure | Pyramid Diagram | What is a Quality ...
- Organizational culture - Triangle diagram | Pyramid Diagram ...
- Organizational Structure | Flow chart Example. Warehouse ...
- Venn Diagrams | Hiring Process | Network Visualization with ...
- Process Flowchart | Pyramid Diagram | Matrix Organization Structure ...
- Organizational culture - Triangle diagram | Organizational culture ...
- Aid Diagram Example
- Venn Diagram Examples for Problem Solving. Environmental Social ...
- Organizational Structure | Organizational culture - Triangle diagram ...
- Venn Diagrams | Pyramid Diagram | How To use House Electrical ...
- Culture Flowchart Images
- Professions - Vector stencils library | Pyramid Diagram ...
