Venn Diagram Examples for Problem Solving. Environmental Social Science. Human Sustainability Confluence
The Venn diagram example below shows sustainable development at the confluence of three constituent parts. Create your Venn diagrams for problem solving in environmental social science using the ConceptDraw DIAGRAM diagramming and vector drawing software extended with the Venn Diagrams solution from the area "Diagrams" of ConceptDraw Solution Park.Venn Diagram Examples for Problem Solving. Computer Science. Chomsky Hierarchy
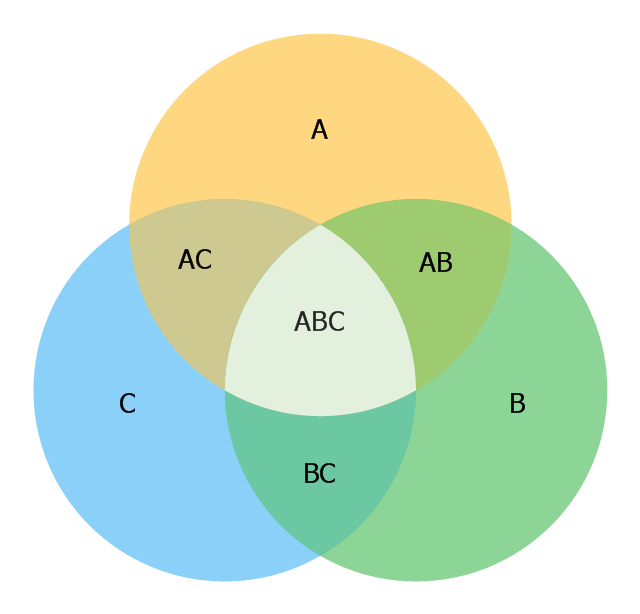
A Venn diagram, sometimes referred to as a set diagram, is a diagramming style used to show all the possible logical relations between a finite amount of sets. In mathematical terms, a set is a collection of distinct objects gathered together into a group, which can then itself be termed as a single object. Venn diagrams represent these objects on a page as circles or ellipses, and their placement in relation to each other describes the relationships between them. The Venn diagram example below visualizes the the class of language inclusions described by the Chomsky hierarchy.Use this template to design your three-set Venn diagrams.
"Definition of VENN DIAGRAM: a graph that employs closed curves and especially circles to represent logical relations between and operations on sets and the terms of propositions by the inclusion, exclusion, or intersection of the curves" [merriam-webster.com/ dictionary/ venn%20 diagram]
The template "3-set Venn diagram" is included in the Venn diagrams solution from the area "What is a Diagram" of ConceptDraw Solution Park.
The vector stencils library "Transport map" contains 96 pictograms for drawing transport maps.
Use it in your spatial infographics for visual representation of transport schemes and plans as metro maps in the ConceptDraw PRO diagramming and vector drawing software extended with the Spatial Infographics solution from the area "What is Infographics" of ConceptDraw Solution Park.
Use it in your spatial infographics for visual representation of transport schemes and plans as metro maps in the ConceptDraw PRO diagramming and vector drawing software extended with the Spatial Infographics solution from the area "What is Infographics" of ConceptDraw Solution Park.
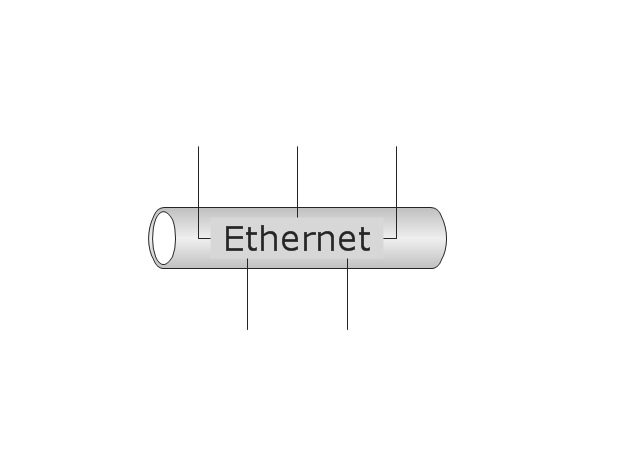
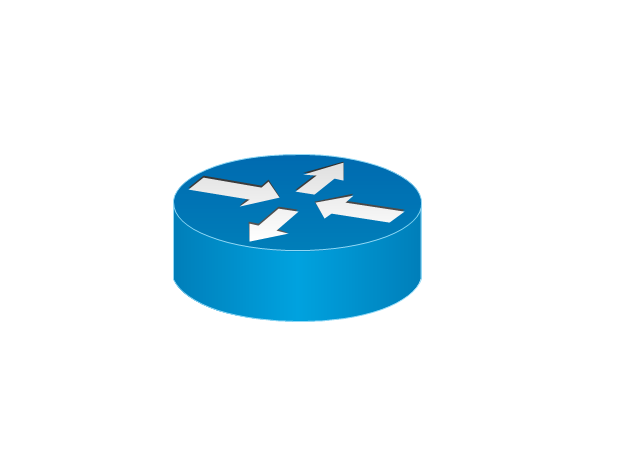
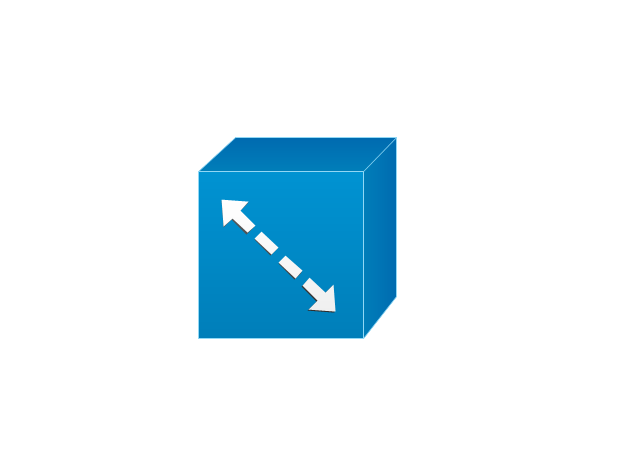
The vector stencils library "Logical symbols" contains 49 logical symbols for drawing logical network topology diagrams.
"Logical topology, or signal topology, is the arrangement of devices on a computer network and how they communicate with one another. How devices are connected to the network through the actual cables that transmit data, or the physical structure of the network, is called the physical topology. Physical topology defines how the systems are physically connected. It represents the physical layout of the devices on the network. The logical topology defines how the systems communicate across the physical topologies.
Logical topologies are bound to network protocols and describe how data is moved across the network. ... EXAMPLE : twisted pair Ethernet is a logical bus topology in a physical star topology layout. While IBM's token ring is a logical ring topology, it is physically set up in star topology." [Logical topology. Wikipedia]
The icons example "Logical symbols - Vector stencils library" was created using the ConceptDraw PRO diagramming and vector drawing software extended with the Computer and Networks solution from the Computer and Networks area of ConceptDraw Solution Park.
www.conceptdraw.com/ solution-park/ computer-and-networks
Venn Diagram Examples for Problem Solving
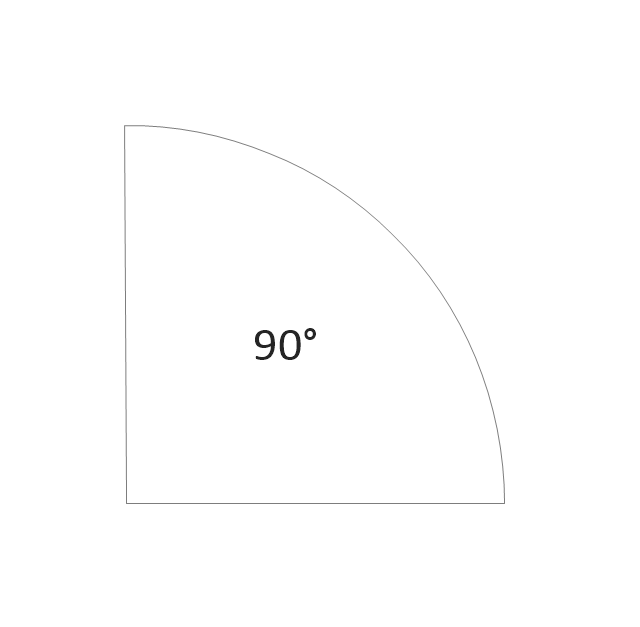
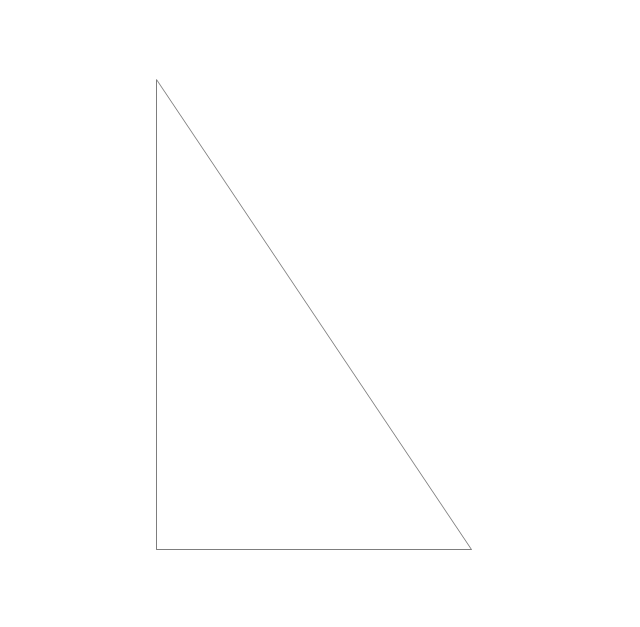
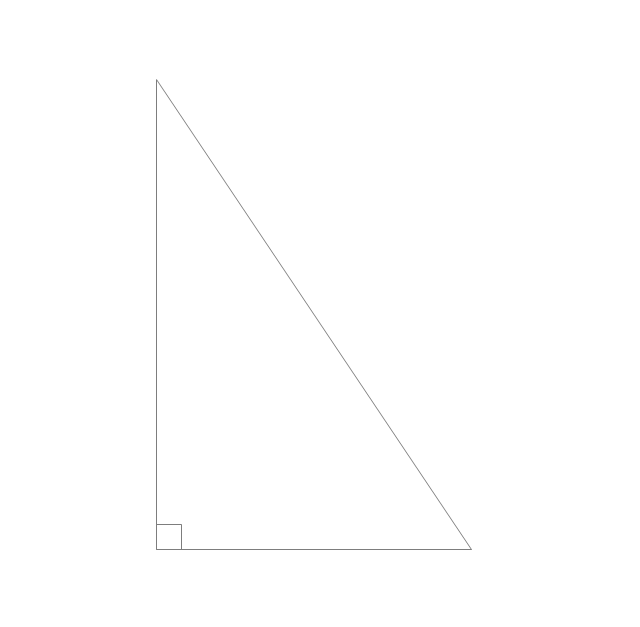
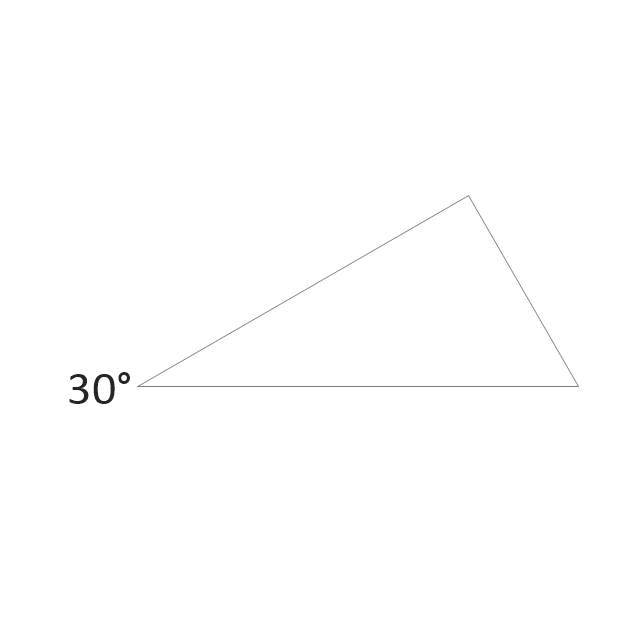
Venn diagrams are illustrations used in the branch of mathematics known as set theory. They show the mathematical or logical relationship between different groups of things (sets). A Venn diagram shows all the possible logical relations between the sets.The vector stencils library "Plane geometry" contains 27 plane geometric figures.
Use these shapes to draw your geometrical diagrams and illustrations in the ConceptDraw PRO diagramming and vector drawing software extended with the Mathematics solution from the Science and Education area of ConceptDraw Solution Park.
Use these shapes to draw your geometrical diagrams and illustrations in the ConceptDraw PRO diagramming and vector drawing software extended with the Mathematics solution from the Science and Education area of ConceptDraw Solution Park.
HelpDesk
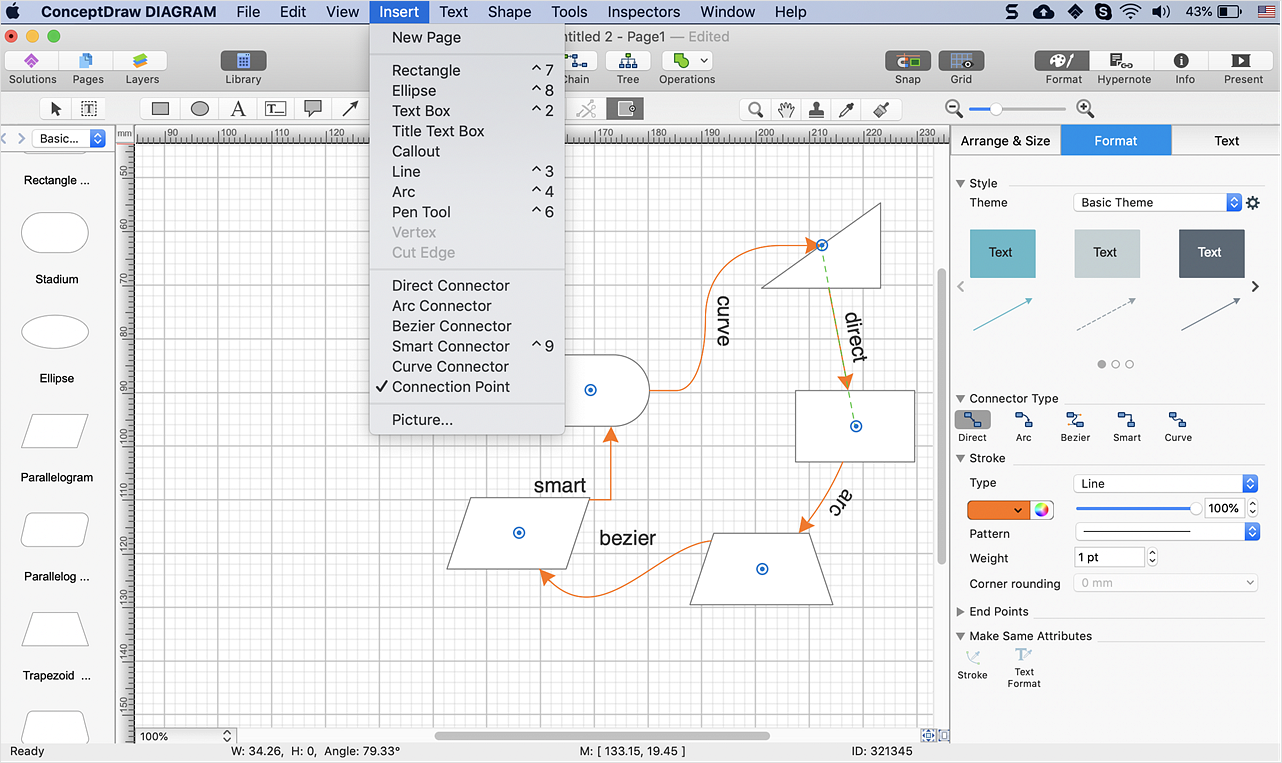
How to Connect Objects on Mac
ConceptDraw DIAGRAM provides a few options for drawing connections between. This article describes how you can connect objects with connectors and how you can ascribe them different types and behaviors.- Transport map - Vector stencils library
- Transport map - Vector stencils library
- Bell Curve Graph Template
- Logical symbols - Vector stencils library
- Plane geometry - Vector stencils library
- Curve Arrow
- Bell Curve
- Roger S Innovation Diffusion Theory Curve
- ConceptDraw | Press Releases
- 3 Circle Venn Diagram Template






















































































-logical-symbols---vector-stencils-library.png--diagram-flowchart-example.png)
