 House of Quality
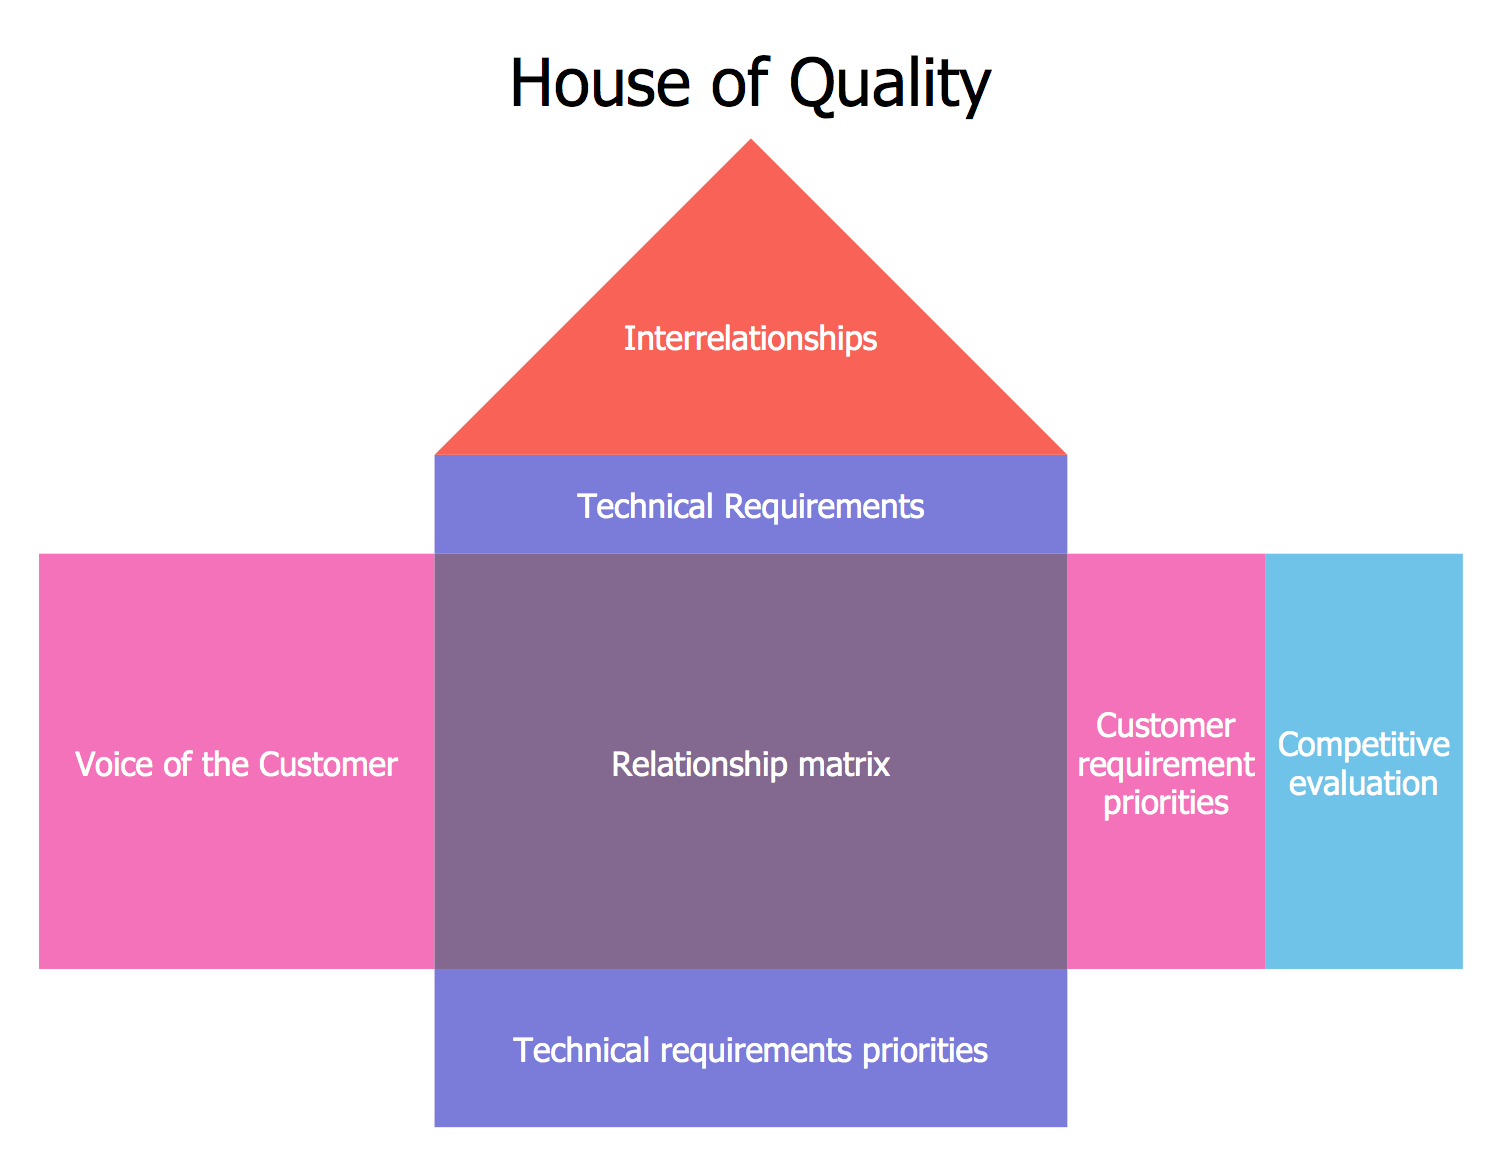
House of Quality solution provides the powerful drawing tools, numerous specific samples and examples, and set of vector design elements of House of Quality shapes and symbols, which will help you in application the Quality function deployment (QFD) methodology and in easy creation the House of Quality Matrices intended for satisfaction the consumers' desires and requirements, for representing them in a visual way and then transformation into the targets and technical requirements to be followed for development the best products.
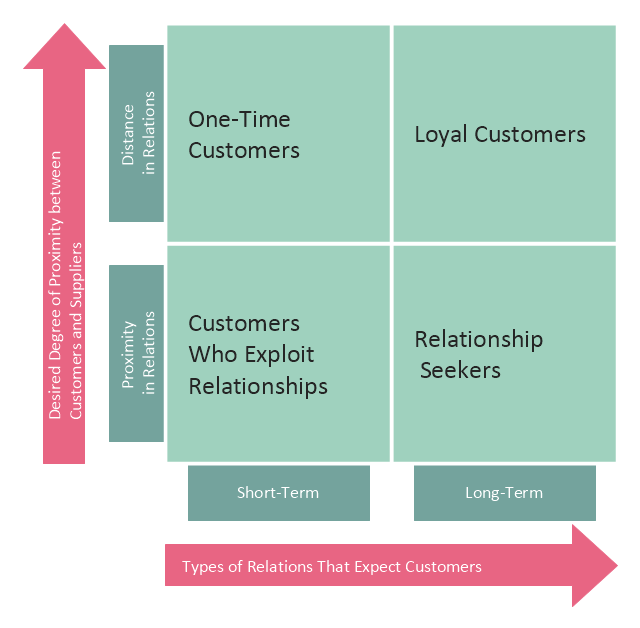
This customer types matrix diagram distribute customers into four categories depending of two criteria: 1) desired degree of proximity between customers and suppliers, and 2) types of relations that expect customers.
One time customers have short-term relations with suppliers and characterized by distance in relations with them.
Loyal customers have long-term relations with suppliers and characterized by distance in relations with them.
Customers who exploit relationships have short-term relations with suppliers and characterized by proximity in relations with them.
Relationship seekers have long-term relations with suppliers and characterized by proximity in relations with them.
This customer types matrix diagram example was created using the ConceptDraw PRO diagramming and vector drawing software extended with the Matrices solution from the Marketing area of ConceptDraw Solution Park.
Product Planning
Any product planning matrix can be also named as the "house of quality". Being a matrix that can organize all the needed customer requirements as well as the product design ones into some particular structure and analyze the interactions between such requirements, a product planning matrix can be created with the help of ConceptDraw DIAGRAM diagramming and drawing software with the help of the House of Quality solution that is the one which contains all the needed tools, such as the design elements and the pre-made templates to complete the drawing within a short period of time.The Sales Process
The Sales Process is a complex approach for selling a product or service which assumes many steps including the sales planning, realization of the sales marketing and management strategies, sales process analysis, etc. Now we have a ConceptDraw DIAGRAM software extended with unique Sales Flowcharts solution from the Marketing area of ConceptDraw Solution Park which ideally suits for the planning and realization the company's sales process.Competitor Analysis
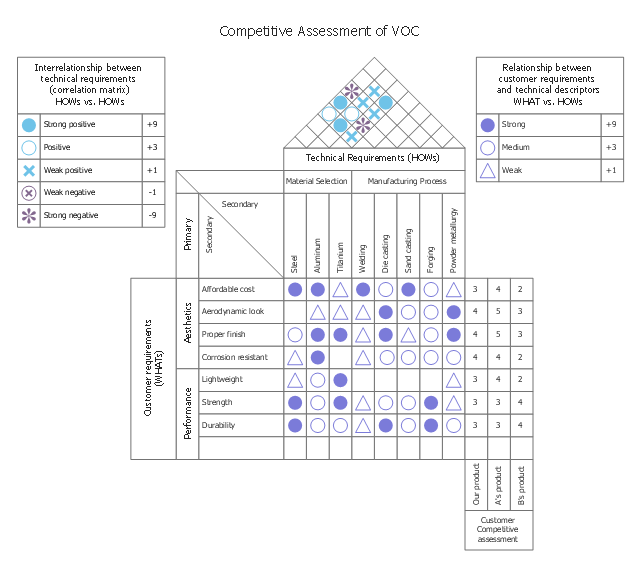
Competitor analysis is a first and obligatory step in elaboration the proper corporate marketing strategy and creating sustainable competitive advantage. Use powerful opportunities of numerous solutions from ConceptDraw Solution Park for designing illustrative diagrams, charts, matrices which are necessary for effective competitor analysis.This house of quality sample illustrates competative assessment of voice of the customer (VOC).
It was designed on the base of the figure 3-6 in Lecture "How QFD helps in product quality improvement?" from the website of National Programme on Technology Enhanced
Learning (NPTEL), India. [nptel.ac.in/ courses/ 110101010/ downloads/ mod3/ Module%20 III-Lec1.pdf]
Distributed under Creative Commons Attribution-ShareAlike 4.0 International (CC BY-SA 4.0) [creativecommons.org/ licenses/ by-sa/ 4.0/ ]
"The customer’s competitive assessment (Figure 3-6) is a pair of table (or graph) that depicts how competitive products compare with current organization product status on specific VOC. The customer competitive assessment is the block of columns corresponding to each customer requirement in the house of quality on the right side of the relationship matrix, The numbers 1 through 5 are listed in the competitive evaluation column to indicate a rating of 1 for worst and 5 for best. The customer competitive assessment is a good way to determine if the customer voice has been met (as compared to best competitor) and identify areas to improvement for future design." [nptel.ac.in/ courses/ 110101010/ modules/ module3/ lec1/ 1.8.html]
The HOQ example "House of Quality - customer’s competitive assessment" was designed using ConceptDraw PRO software extended with House of Quality solution from Quality area of ConceptDraw PRO Solution Park.
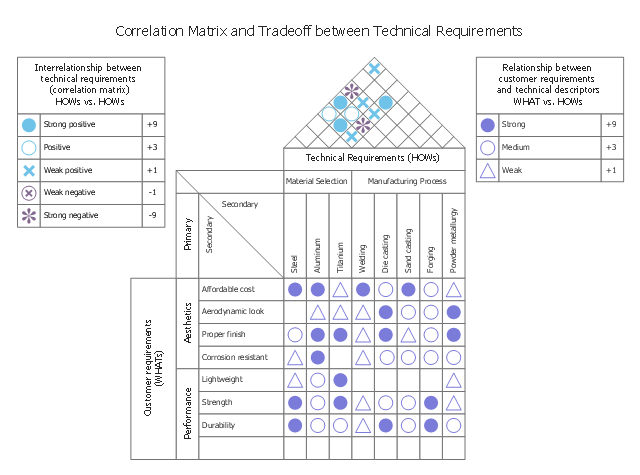
This house of quality sample illustrates correlation matrix.
It was designed on the base of the figure 3-5 in Lecture "How QFD helps in product quality improvement?" from the website of National Programme on Technology Enhanced Learning (NPTEL), India. [nptel.ac.in/ courses/ 110101010/ downloads/ mod3/ Module%20 III-Lec1.pdf]
Distributed under Creative Commons Attribution-ShareAlike 4.0 International (CC BY-SA 4.0) [creativecommons.org/ licenses/ by-sa/ 4.0/ ]
"After drafting the relationship matrix, it is evaluated for any empty row or column. An empty row indicates that a customer voice is not being addressed by any technical descriptors. Thus, the customer expectation is not being met. Any blank column indicates that the technical requirement is unnecessary, as it does not address any VOC.
The roof of the house of quality, expressed as correlation matrix, is used to identify any interrelationships between the technical descriptors (Figure 3-5). Symbols are used to describe the strength of the interrelationships. Symbols generally preferred are:
- A ‘solid circle’ represents a strong positive relationship.
- A ‘circle’ represents a positive relationship.
- An ‘X’ represents a negative relationship.
- An ‘asterisk’ represents a strong negative relationship." [nptel.ac.in/ courses/ 110101010/ modules/ module3/ lec1/ 1.7.html]
The HOQ example "House of Quality - correlation matrix" was designed using ConceptDraw PRO software extended with House of Quality solution from Quality area of ConceptDraw PRO Solution Park.
 Marketing Diagrams
Marketing Diagrams solution extends ConceptDraw DIAGRAM diagramming software with abundance of samples, templates and vector design elements intended for easy graphical visualization and drawing different types of Marketing diagrams and graphs, including Branding Strategies Diagram, Five Forces Model Diagram, Decision Tree Diagram, Puzzle Diagram, Step Diagram, Process Chart, Strategy Map, Funnel Diagram, Value Chain Diagram, Ladder of Customer Loyalty Diagram, Leaky Bucket Diagram, Promotional Mix Diagram, Service-Goods Continuum Diagram, Six Markets Model Diagram, Sources of Customer Satisfaction Diagram, etc. Analyze effectively the marketing activity of your company and apply the optimal marketing methods with ConceptDraw DIAGRAM software.
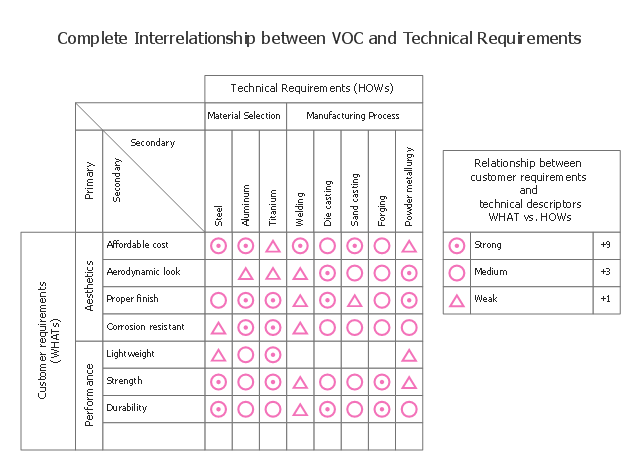
This house of quality sample illustrates interrelationship matrix.
It was designed on the base of the figure 3-4 in Lecture "How QFD helps in product quality improvement?" from the website of National Programme on Technology Enhanced
Learning (NPTEL), India. [nptel.ac.in/ courses/ 110101010/ downloads/ mod3/ Module%20 III-Lec1.pdf]
Distributed under Creative Commons Attribution-ShareAlike 4.0 International (CC BY-SA 4.0) [creativecommons.org/ licenses/ by-sa/ 4.0/ ]
"The next step in building a house of quality is to compare the VOC with technical characteristics and determine their interrelationships. In this context, engineering knowledge about the product and historic evidence/ data can provide useful information. Common practice is to use symbols to represent the nature of relationship between customer requirements and technical descriptors. Symbols used are:
- A solid circle represents a strong relationship (scored as +9).
- A single circle represents a medium relationship. (scored as +3).
- A triangle represents a weak relationship (scored as +1).
- The box is left blank if there is no relationship between VOC and technical characteristics.
Figure 3-4 provides the interrelationship matrix with type of relationships. Any cell that is empty implies no or insignificant relationship." [nptel.ac.in/ courses/ 110101010/ modules/ module3/ lec1/ 1.6.html]
The HOQ example "House of Quality - interrelationship matrix" was designed using ConceptDraw PRO software extended with House of Quality solution from Quality area of ConceptDraw PRO Solution Park.
 Matrices
This solution extends ConceptDraw DIAGRAM software with samples, templates and library of design elements for drawing the business matrix diagrams.
- Relationship Matrix Example
- Customer types matrix | PROBLEM ANALYSIS. Relations Diagram ...
- Entity- Relationship Diagram (ERD) | How to Help Customers be ...
- Customer types matrix | Eisenhower box | Matrices | Relationship ...
- Relationship Matrix Template Excel
- Data Flow Diagram In Customer Relationship Management Planninh
- Customer types matrix | Block diagram - Sources of customer ...
- Matrices | Competitor Analysis | BCG Matrix | Types Of Matrix In ...
- Matrices | Social Media Response | Sample Of Customer Matrix
