HelpDesk
How to Create a Bank ATM Use Case Diagram
UML diagrams are often used in banking management for documenting a banking system. In particular, the interaction of bank customers with an automated teller machine (ATM) can be represented in a Use Case diagram. Before the software code for an ATM, or any other system design, is written, it is necessary to create a visual representation of any object-oriented processes. This is done most effectively by creating a Unified Modeling Language (UML) diagram, using object-oriented modeling. UML works as a general purpose modeling language for software engineers or system analysts, offering a number of different diagram styles with which to visually depict all aspects of a software system. ConceptDraw DIAGRAM diagramming software, enhanced and expanded with the ATM UML Diagrams solution, offers the full range of icons, templates and design elements needed to faithfully represent ATM and banking information system architecture using UML standards. The ATM UML Diagrams solution is useful for beginner and advanced users alike. More experienced users will appreciate a full range of vector stencil libraries and ConceptDraw DIAGRAM 's powerful software, that allows you to create your ATM UML diagram in a matter of moments.
 ATM UML Diagrams
The ATM UML Diagrams solution lets you create ATM solutions and UML examples. Use ConceptDraw DIAGRAM as a UML diagram creator to visualize a banking system.
HelpDesk
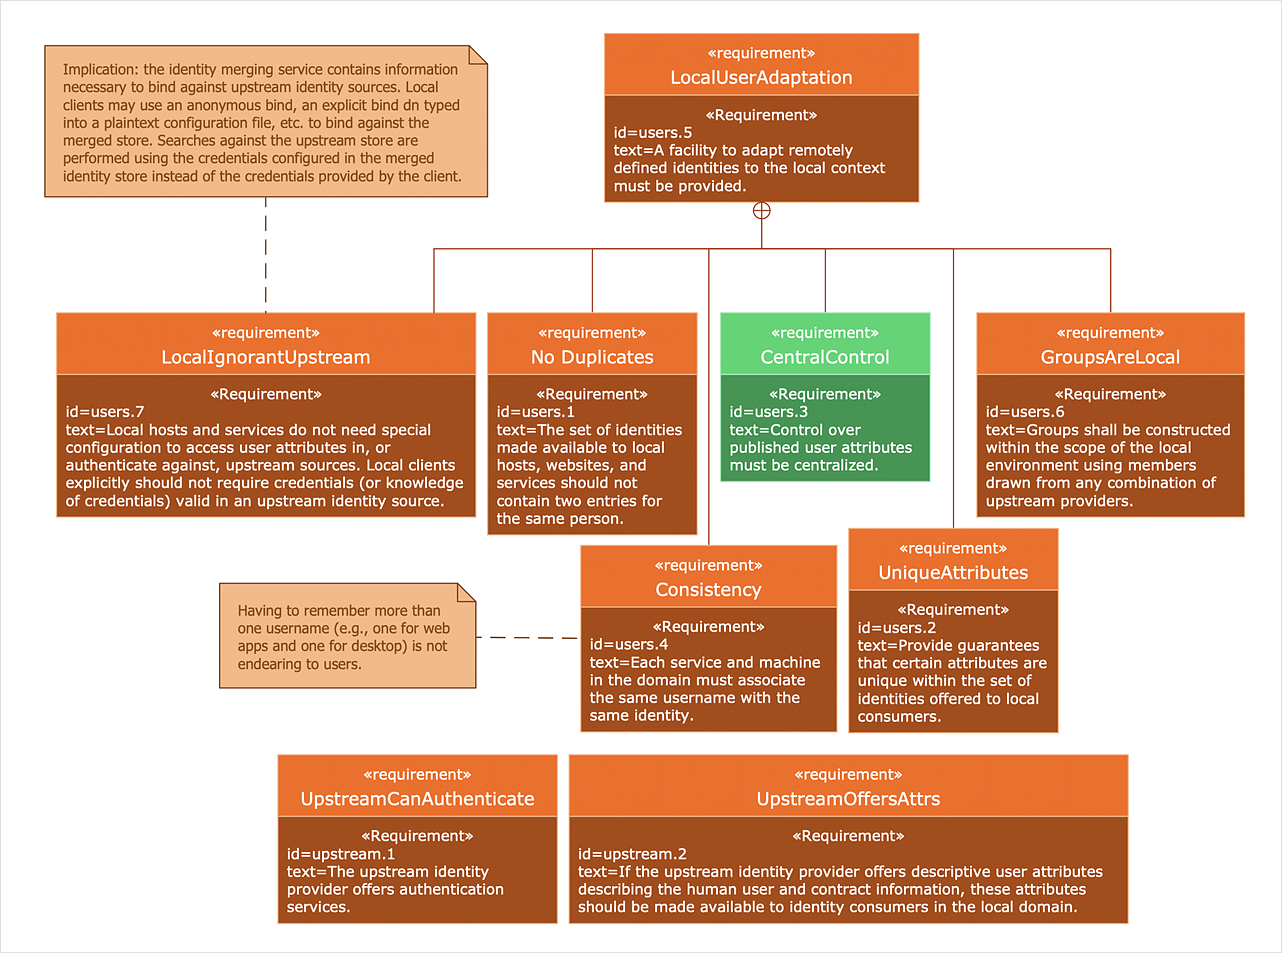
How to Create a SysML Diagram
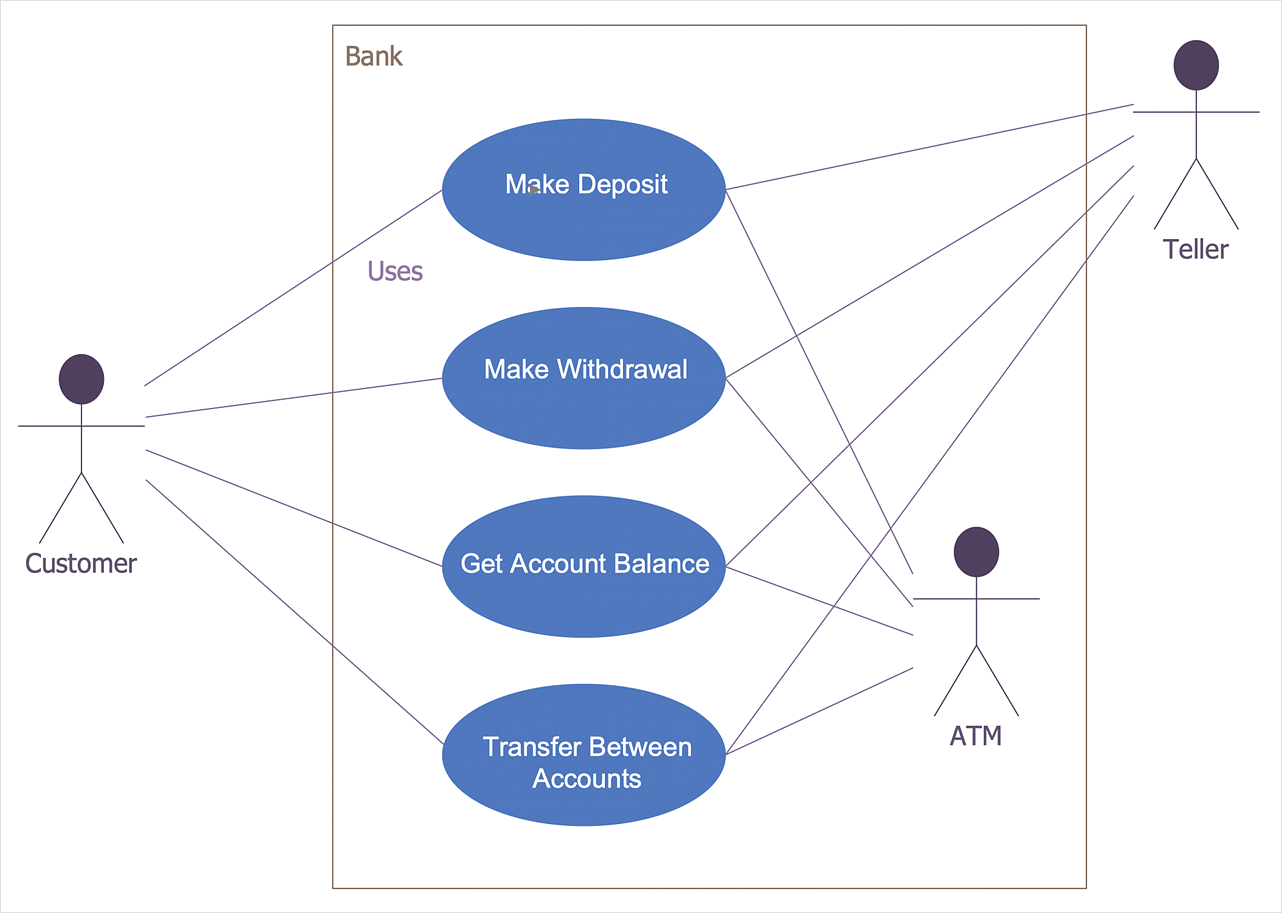
Systems Modeling Language (SysML) is designed to use for system engineering. It is similar to UML but much easier to learn. used by to system engineers what UML is to software engineers. Smaller in content and simpler to learn than UML. SysML is focused on standardizing the language used to describe engineering systems. SysML covers a broader range of systems that can involve personnel, facilities, hardware or electrical components. SysML depicts system using the SysML diagrams. Making a SysML diagram involves many elements that can be managed using SysML solution for ConceptDraw DIAGRAM.UML Use Case Diagram Example. Services UML Diagram. ATM system
Services UML Diagram. ATM system. This sample was created in ConceptDraw DIAGRAM diagramming and vector drawing software using the UML Use Case Diagram library of the Rapid UML Solution from the Software Development area of ConceptDraw Solution Park. This sample shows the scheme of the servicing using the ATMs (Automated Teller Machines) and is used at the working of ATM banking systems, at the performing of the banking transactions.HelpDesk
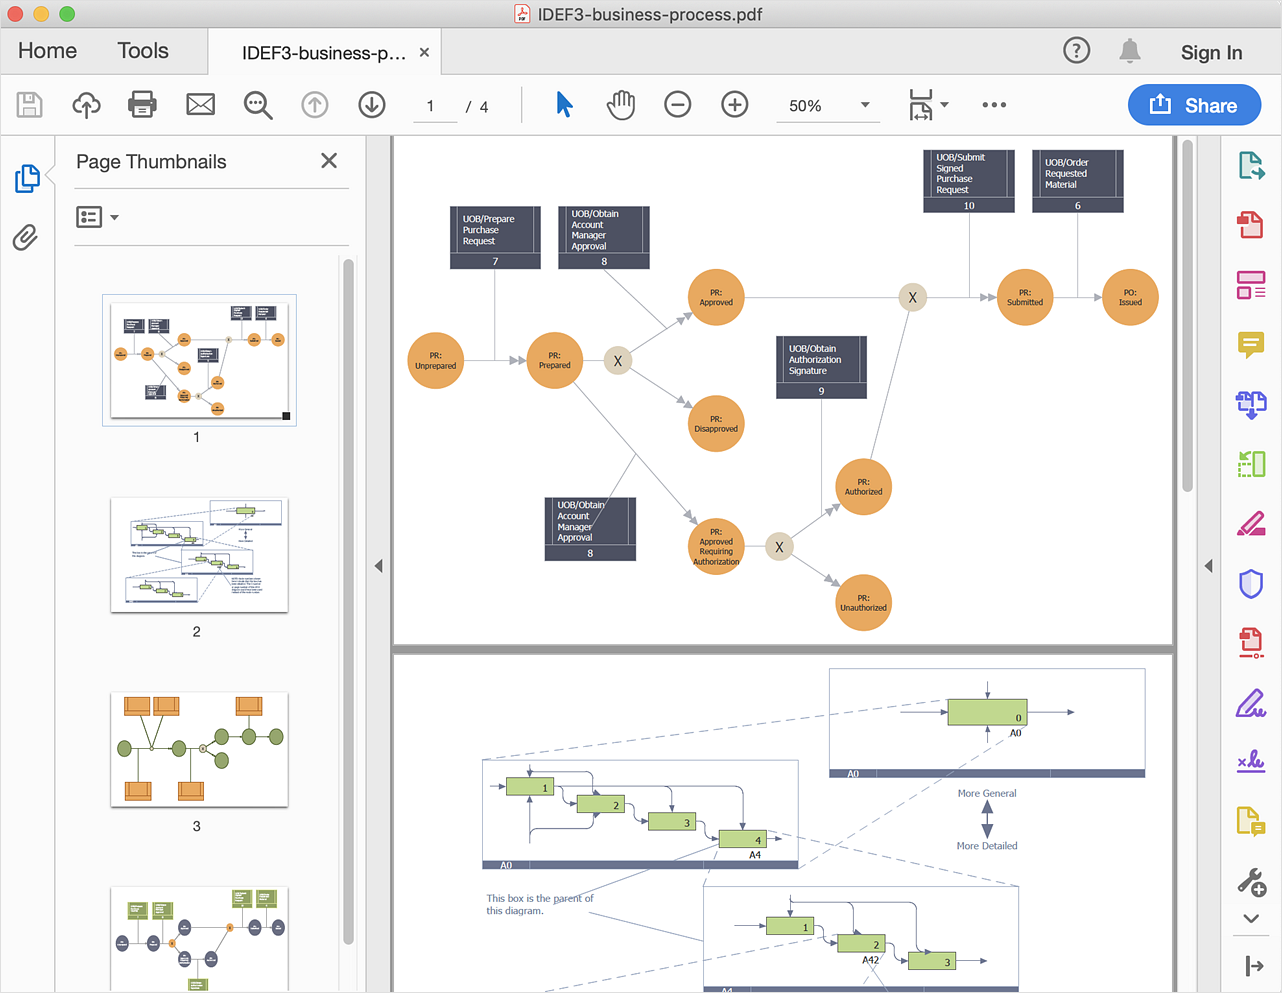
How To Convert a Business Process Diagram to Adobe PDF
ConceptDraw DIAGRAM allows you to easy exchange your business process diagrams between different computers with different operating systems and applications using it's export capabilities. You can get clear business process documentation in pdf format and avoid any problems while communicating it with stakeholders.UML Tool & UML Diagram Examples
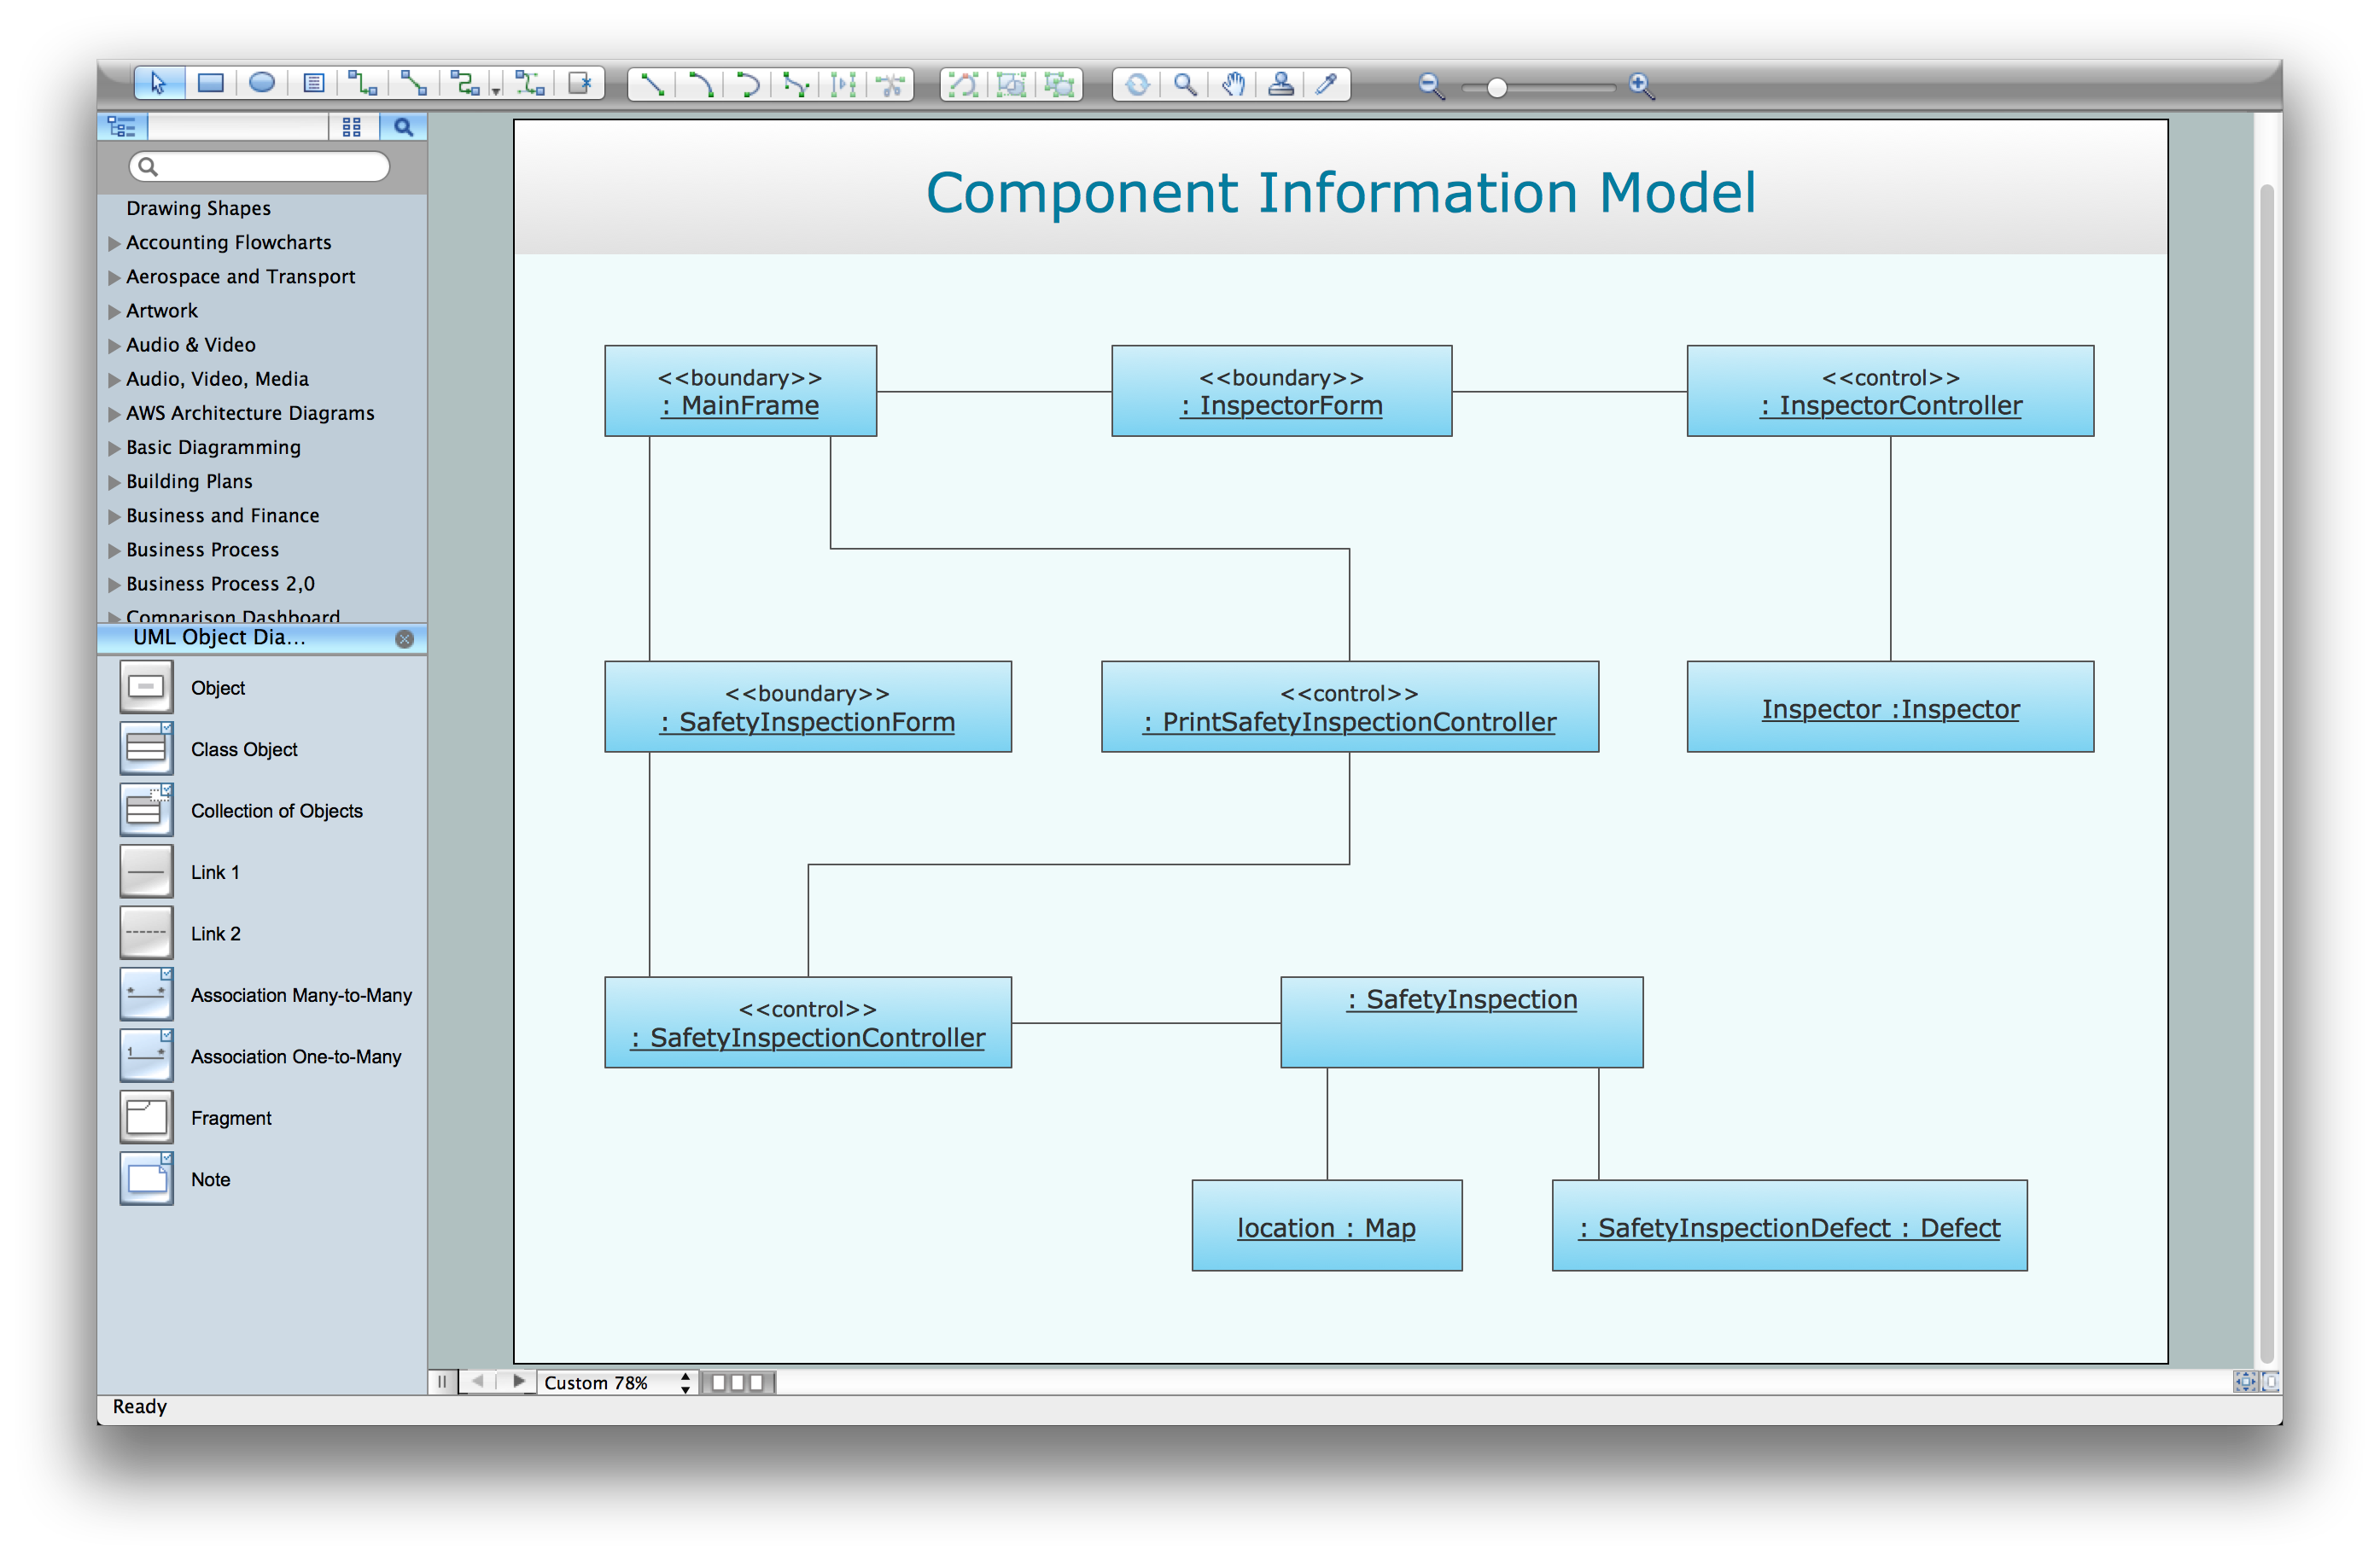
The Unified Modeling Language (abbr. UML) is a general-purpose modeling language widely used in the field of software development, software engineering, education, science, industry, business. In 1997 the UML was approved as a standard by the OMG (Object Management Group) and in 2005 was published as ISO standard by the International Organization for Standardization. UML is widely and succesfully applied for optimization the process of software systems development and business systems analysis. There are used 14 types of UML diagrams, 7 from them depict structural information, another 7 types represent different types of behavior and aspects of interactions. Design of any automated process is easy with ConceptDraw DIAGRAM and unique Rapid UML solution from the Software Development area, which provides numerous UML examples, templates and vector stencils libraries for drawing all types of UML 1.x and UML 2.x diagrams. Use of predesigned UML diagram examples and templates lets you quickly start drawing your own UML diagrams in ConceptDraw DIAGRAM software.HelpDesk
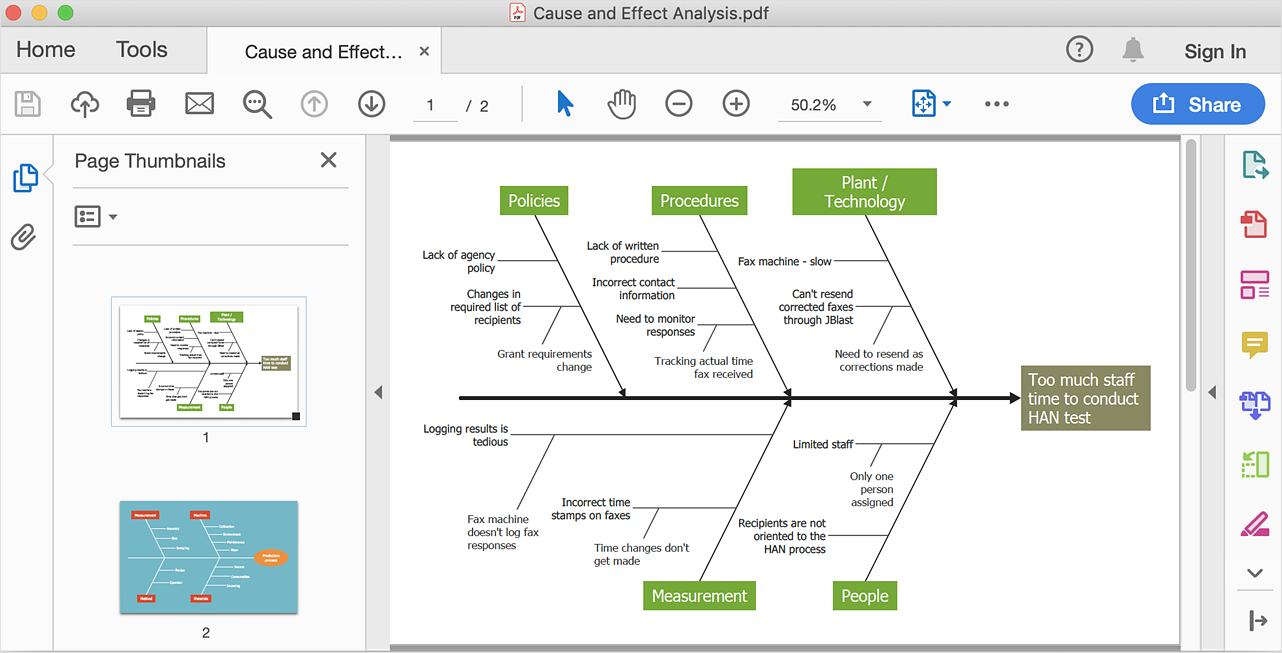
How To Convert a Fishbone Diagram to Adobe PDF
ConceptDraw DIAGRAM allows you to easy transmit visual documentation between different computers with different operating systems and applications using it's export capabilities.You can get clear business documentation pack in pdf format and easily communicate it with stakeholders.UML Diagram for System
This sample shows the UML Class Diagram of delivery system. On this diagram you can see the classes that are connected with aggregation and composition associations indicated with the multiplicity. This sample can be used by delivery services, postal services.
 Rapid UML
Rapid UML solution extends ConceptDraw DIAGRAM software with templates, samples and libraries of vector stencils for quick drawing the UML diagrams using Rapid Draw technology.
HelpDesk
Accounting Information Systems Flowchart Symbols
Accounting Information system is a combination of software and hardware, as well as organizational support. Information system - it is not only the software and computers with network equipment, but also a list of instructions and standards which can be notated using Accounting information systems flowchart symbols. All information systems can be divided into information retrieval and data processing systems. Data Flow model is a hierarchical model. Each process can be divided into structural components, that depict by corresponding flowchart symbols, showing the accounting information system in communication with the external environment. The major components of accounting information systems flowchart are: entities, processes, data stores, and data flows. The set of standard accounting information flowchart symbols is intended to show the relationships between the system components. ConceptDraw DIAGRAM can help to draw clear accounting information system diagrams using special flowchart symbols.Banking System
ConceptDraw DIAGRAM extended with ATM UML Diagrams Solution from the Software Development Area of ConceptDraw Solution Park is a powerful software for representing the ATM processes, for designing and building banking system and ATMs.Bank UML Diagram
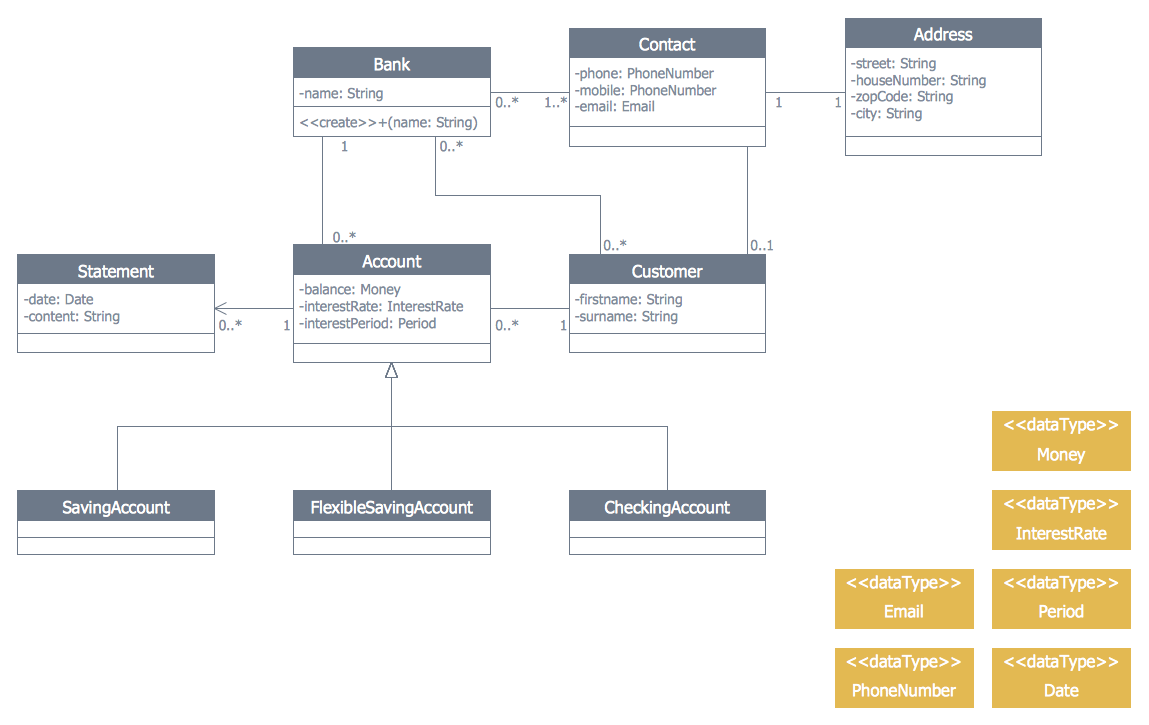
You need design a Bank UML Diagram? Now, thanks to the ConceptDraw DIAGRAM diagramming and vector drawing software extended with ATM UML Diagrams Solution from the Software Development Area, you can design without efforts any type of Bank UML Diagram you want - Class, Activity, Communication, Component, Composite structure, Deployment, Interaction overview, Object, Package, Profile, Sequence, State machine, Timing, Use case.How To Create a Workflow Diagram
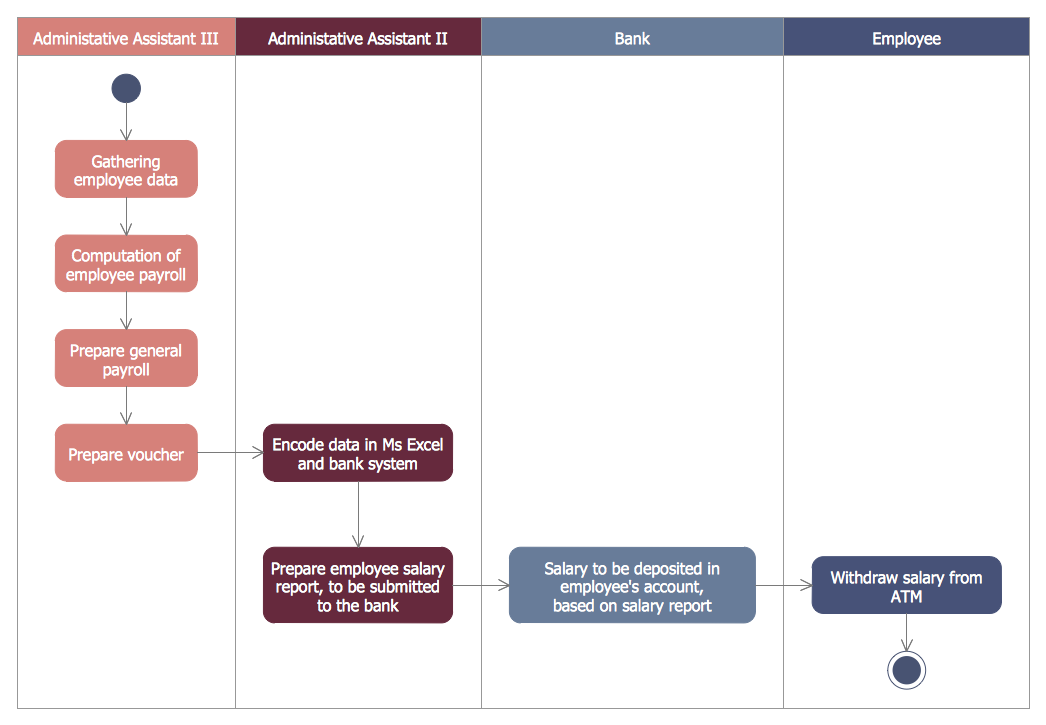
A workflow diagram is less general notation than a process flow diagram. Workflow as a term can apply to organizational process which involves people, resources, documents, sort of data, for instance; whereas a process is general collection of steps occuring in any sort of activity. That is why process flow diagram can be used as workflow diagram to describe business process, data flow or department interactions. The fastest way to create a workflow diagram is using pre-designed workflow template. ConceptDraw DIAGRAM with the Workflow Diagrams solution delivers rich set of workflow diagram templates you may start from.UML Flowchart Symbols
The UML diagram is a powerful tool which lets visually represent all system's components, the interactions between them and relationships with external user interface. The Rapid UML solution for ConceptDraw DIAGRAM software offers diversity of UML flowchart symbols for drawing all types of UML diagrams.HelpDesk
How to Create a Data Flow Diagram
Data flow diagramming is a highly effective technique for showing the flow of information through a system. Data flow diagrams reveal relationships among and between the various components in a program or system. DFD is an important technique for modeling a system’s high-level detail by showing how input data is transformed to output results through a sequence of functional transformations. The set of standard symbols is used to depict how these components interact in a system. ConceptDraw DIAGRAM allows you to draw a simple and clear Data Flow Diagram using special libraries.Process with UML
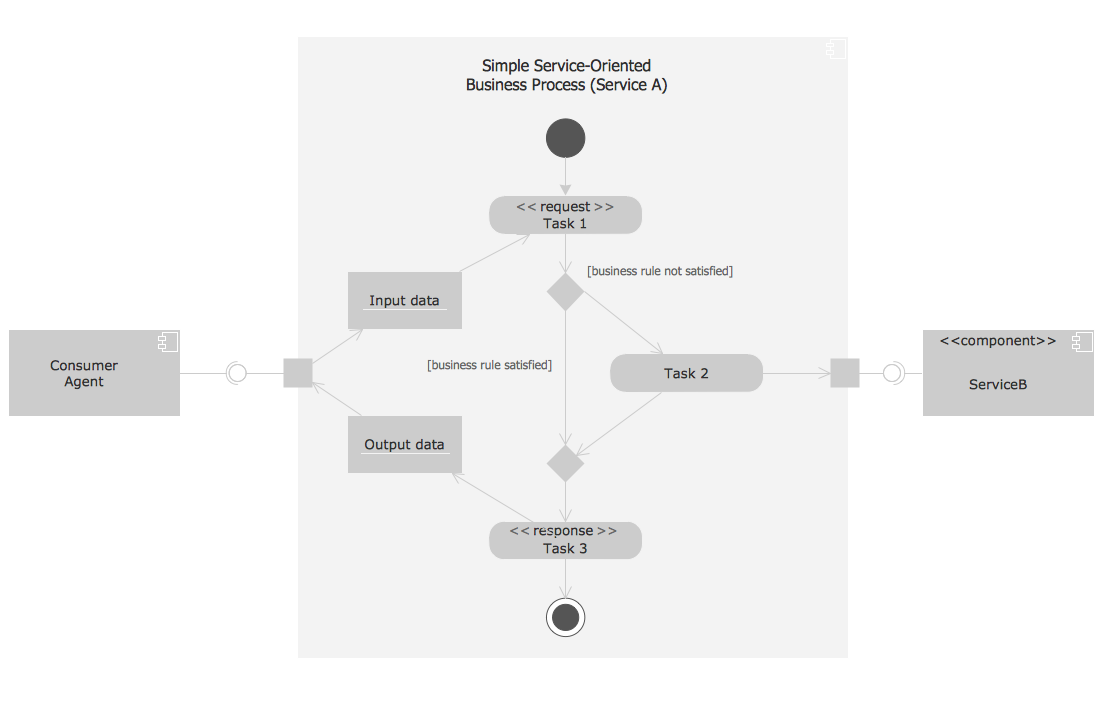
This UML activity diagram shows the abstract example of orchestration of service-oriented business process. Orchestration is the method for composition the hierarchical and self-contained service-oriented business processes. It is coordinated by the single agent. This sample was created in ConceptDraw DIAGRAM diagramming and vector drawing software using the Rapid UML Solution from the Software Development area of ConceptDraw Solution Park.
 Business Process Diagrams
Business Process Diagrams solution extends the ConceptDraw DIAGRAM BPM software with RapidDraw interface, templates, samples and numerous libraries based on the BPMN 1.2 and BPMN 2.0 standards, which give you the possibility to visualize equally easy simple and complex processes, to design business models, to quickly develop and document in details any business processes on the stages of project’s planning and implementation.
UML Software
Unified Modeling Language (UML) is a language of graphic description for object modeling in the field of software engineering. UML was created for definition, visualization, designing of software systems. UML is an open standard that uses graphic notations for creating visual models of object-oriented software systems. The Rapid UML Solution for ConceptDraw DIAGRAM presentsthe intuitive RapidDraw interface that helps you to make the UML Diagram of any of these 13 types quick and easy.What Is a Circle Spoke Diagram
What Is a Circle Spoke Diagram? It is a diagram which have a central item surrounded by other items in a circle. The Circle Spoke Diagrams are often used to show the features or components of the central item in marketing and management documents and presentations. ConceptDraw DIAGRAM extended with Circle-Spoke Diagrams Solution from the "Diagrams" Area is the best software for creating Circle-Spoke Diagrams.HelpDesk
How to Create an IDEF0 Diagram for an Application Development
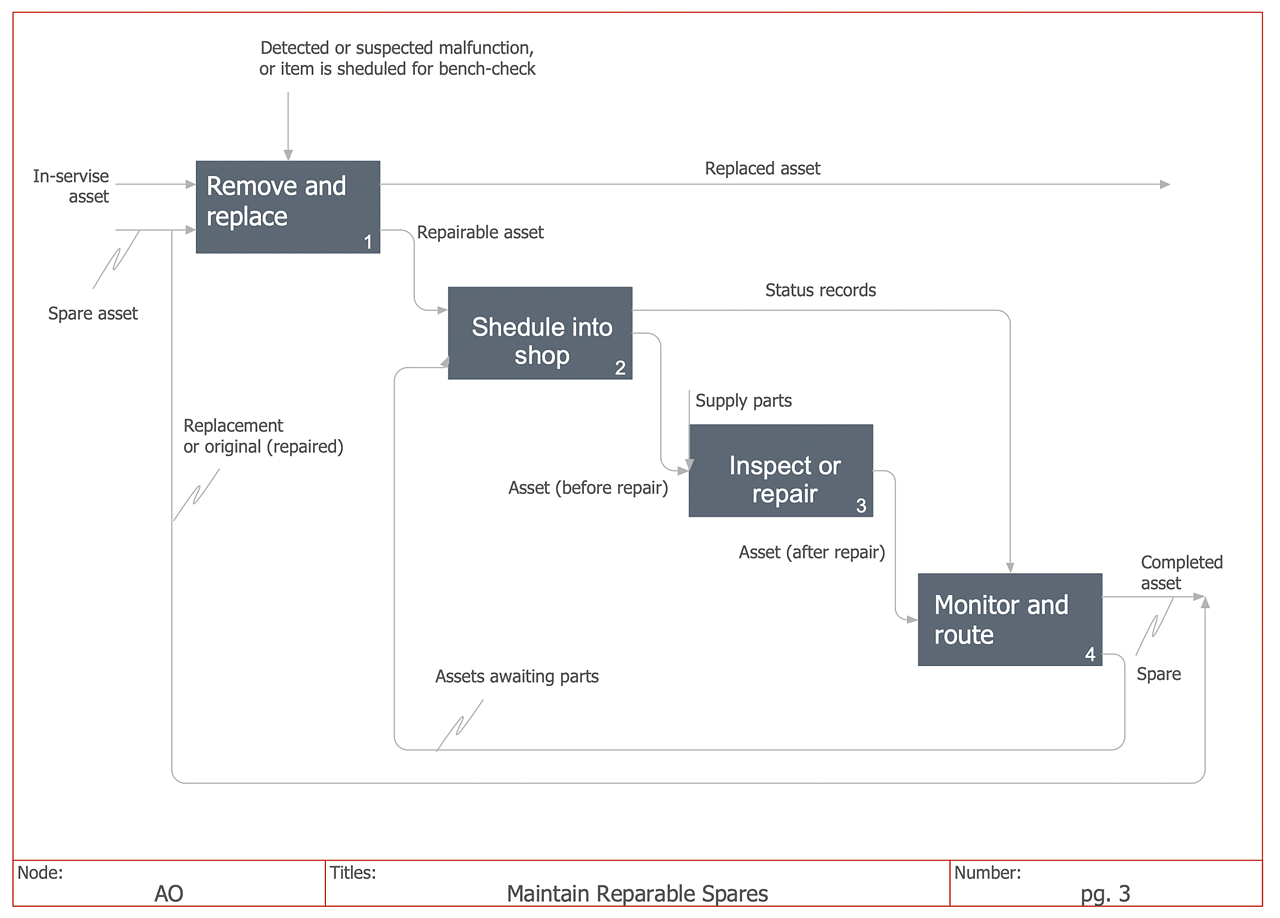
IDEF0 methods are intended to model the functions of a process, creating a graphical model that displays: what controls the function, who makes it, what resources are used and how they are connected with other functions. The IDEF0 tool is used to model the decisions, actions, and activities of a software system during the development process. IDEF0 diagram graphically depicts a model of a desired version of the application. ConceptDraw DIAGRAM allows you to create and communicate the IDEF0 diagrams of any complexity.- Component And Deployment Diagrams For Customer Support System
- Class Diagram For Customer Support System
- UML activity diagram - Ticket processing system | UML Use Case ...
- Customer Support System Sequence Uml Diagram
- System Sequence Diagram For Customer Support System
- Uml Diagrams Customer Support System
- Customer Support System Use Case Diagram
- Online Banking System Uml Diagrams Pdf
- Class UML Diagram for Bank Account System | ATM UML Diagrams ...
- Class UML Diagram for Bank Account System | ATM UML Diagrams ...
- UML Use Case Diagram Example. Services UML Diagram . ATM ...
- Use Case Diagram For Pharmacy Management System Pdf
- Class Diagram For Banking Transaction System Pdf
- UML Class Diagram Notation
- ATM UML Diagrams | Uml Diagrams For Atm Machine Pdf Download
- State Machine Diagram | UML Use Case Diagram Example ...
- Uml Diagrams For Atm For Banking System Pdf
- Bank Management System With Uml Ppt Pdf
- Business Support System Block Diagram
