Export from ConceptDraw DIAGRAM Document to a Graphic File


Flowchart design. Flowchart symbols, shapes, stencils and icons


This example is based on the organizational chart from the Ohio State University website. [osu.edu/ vpsearch/ images/ University_ Org_ Chart.png]
"The Ohio State University, a multi-campus land grant institution with an international presence, is a world-class public research university and the leading comprehensive teaching and research institution in the state, Ohio's flagship university. Ohio State provides a distinctive educational experience for students and pursues cutting-edge interdisciplinary research that brings together scholars from diverse disciplines to solve key problems in society.
One of the University's core values is to "ignite a lifelong love of learning" in students. Ohio State students benefit from a scholarly environment in which research inspires and informs teaching.
The Vice President for Student Life provides vision, leadership, and strategic direction to the Office of Student Life, a comprehensive unit dedicated to supporting the educational mission of the University and promoting the best possible overall experience for the diverse student body of approximately 60,000. The Office of Student Life supports every aspect of Ohio State students experience. Its scope includes housing, campus dining, disability services, the multicultural center, counseling and health services, student organizations and leadership development, and other related operations." [osu.edu/ vpsearch/ ]
The organizational chart example "University leadership" was created using the ConceptDraw PRO diagramming and vector drawing software extended with the Organizational Charts solution from the Management area of ConceptDraw Solution Park.
Organizational chart - University leadership

Pyramid Diagram

 Business Process Workflow Diagrams
The Business Process Workflow Diagrams solution enhances the ConceptDraw DIAGRAM functionality with predesigned examples, samples and a numerous collection of predesigned vector objects of workflow chart elements, icons, arrows, connectors, and varied wor
Cisco Network Design. Cisco icons, shapes, stencils, symbols and design elements

 HR Flowcharts
Human resource management diagrams show recruitment models, the hiring process and human resource development of human resources.
 Value Stream Mapping
Value stream mapping solution extends ConceptDraw DIAGRAM software with templates, samples and vector stencils for drawing the Value Stream Maps (VSM) in lean manufacturing practice.
Technical Drawing Software

 Customer Journey Mapping
Customer Journey Mapping Solution for ConceptDraw DIAGRAM opens incredibly broad opportunities for marketing and business specialists, product managers, designers, engineers, and other people interested in business development, increasing the product’s audience, its success and users' demand, providing them with capabilities of customer journey mapping. The included diagramming and customer journey mapping tools, predesigned vector customer journey mapping icons and charts, consumer journey mapping connectors, user journey and customer mapping figures, customer experience map icons and touchpoint icons, quick-start templates and samples provide excellent conditions for the customer journey mapping process, for creating Customer Journey Map and Customer Experience Map.
This example was created on the base of the figure from the website of Minnesota Department of Health. [health.state.mn.us/ divs/ opi/ qi/ images/ fishbone_ ex.png]
"Minnesota’s Health Alert Network (HAN) enables public health staff, tribal governments, health care providers, emergency workers, and others working to protect the public to exchange information during a disease outbreak, environmental threat, natural disaster, or act of terrorism." [health.state.mn.us/ han/ ]
The fishbone diagram example "HAN project" was created using the ConceptDraw PRO diagramming and vector drawing software extended with the Fishbone Diagrams solution from the Management area of ConceptDraw Solution Park.
Ishikawa diagram

Personal area (PAN) networks. Computer and Network Examples
 networks")

The vector stencils library "Active Directory Sites and Services" contains 12 symbol icons of Active Directory Sites and Services design elements for drawing high-level network topology plan diagrams.
"Active Directory® Sites and Services is a Microsoft Management Console (MMC) snap-in that you can use to administer the replication of directory data among all sites in an Active Directory Domain Services (AD DS) forest. This snap-in also provides a view of the service-specific objects that are published in AD DS. ...
Administrators who are responsible for forest-wide service administration can use Active Directory Sites and Services to manage the intersite replication topology for the forest. Administrators who are responsible for application services can be delegated responsibility for the service containers into which application-specific objects are published.
When you add the Active Directory Domain Services server role to a server, Active Directory Sites and Services is added to the Administrative Tools menu." [technet.microsoft.com/ en-us/ library/ cc730868.aspx]
The symbols example "Active Directory Sites and Services - Vector stencils library" was created using the ConceptDraw PRO diagramming and vector drawing software extended with the Active Directory Diagrams solution from the Computer and Networks area of ConceptDraw Solution Park.
www.conceptdraw.com/ solution-park/ active-directory-diagrams
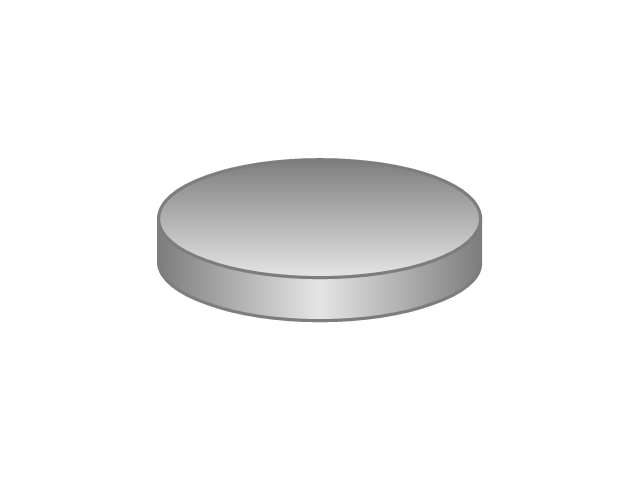
Site or Subnet
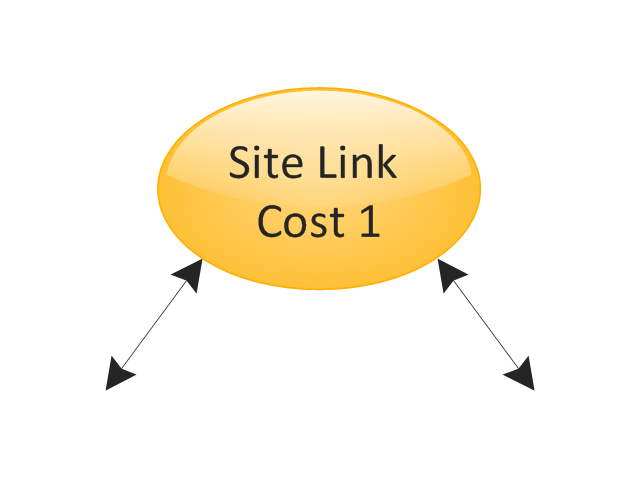
Site Link
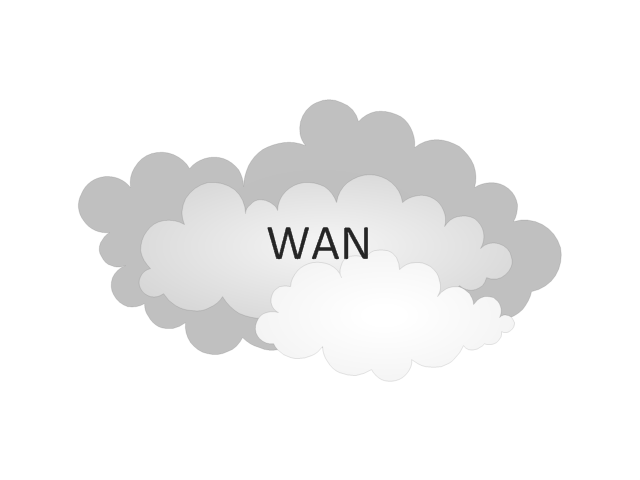
WAN
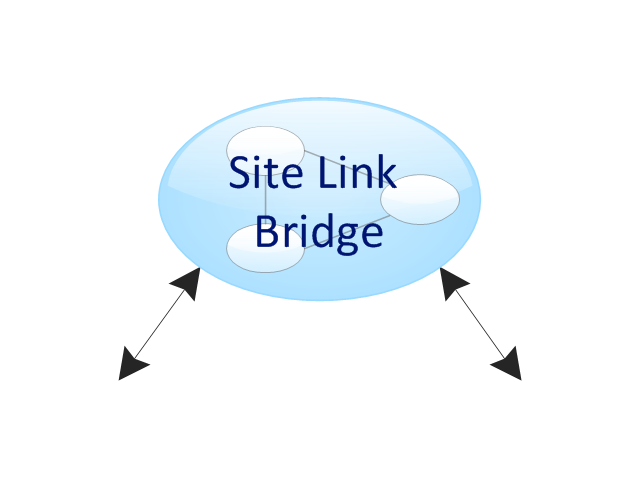
Site Link Bridge
Domain

Domain controller
Application

Database

Comm-link

Client
Replication connection, unidireactional

Replication connection, bi-directional

Entity Relationship Diagram Symbols

The vector stencils library "Professions" contains 58 people clipart images of different professions you can use in your presentations, illustrations and infographics.
"Electronic clip art is available in several different file formats. It is important for clip art users to understand the differences between file formats so that they can use an appropriate image file and get the resolution and detail results they need.
Clip art file formats are divided into 2 different types: bitmap or vector graphics. ...
In contrast to the grid format of bitmap images, Vector graphics file formats use geometric modeling to describe an image as a series of points, lines, curves, and polygons. Because the image is described using geometric data instead of fixed pixels, the image can be scaled to any size while retaining "resolution independence", meaning that the image can be printed at the highest resolution a printer supports, resulting in a clear, crisp image. Vector file formats are usually superior in resolution and ease of editing as compared to bitmap file formats, but are not as widely supported by software and are not well-suited for storing pixel-specific data such as scanned photographs. In the early years of electronic clip art, vector illustrations were limited to simple line art representations." [Clip art. Wikipedia]
The clip art example "Professions - Vector stencils library" was created using the ConceptDraw PRO diagramming and vector drawing software extended with the People solution from the Illustration area of ConceptDraw Solution Park.
www.conceptdraw.com/ solution-park/ illustrations-people
Builder 1

System administrator

Worker of conveyor

Clerk 1

Clerk 2

Student 2

Student 3

Student 1

Dispatcher 1

Accountant

Gardener

Lawyer

Jurist

Judge

Consultant

Manager

Director

Programmer

Architect

Pilot

Policeman

Secretary

Security officer

Clerk 3

Musician

Presenter

Athlete

Artist
Announcer

Photographer

Hairdresser

Florist

Spaceman

Engineer

Reporter

Tailor

Dispatcher 2

Biologist

Chemist

Dentist

Priest

Soldier

Doctor

Driver

Carpenter

Fireman

Seaman

Builder 2

Postman

Miner

Waiter

Cleaner

Cashier

Shop assistant

Cook

Flight attendant

Teacher

Hall porter

 Chemical and Process Engineering
This chemical engineering solution extends ConceptDraw DIAGRAM.9.5 (or later) with process flow diagram symbols, samples, process diagrams templates and libraries of design elements for creating process and instrumentation diagrams, block flow diagrams (BFD
HelpDesk
How to Design a Fast-Food Restaurant Menu

Data Flow Diagram Symbols. DFD Library

How to Create Network Diagrams

- Pyramid Diagram | Online Support Vector Png
- Customer Care Image Png
- Packaging Vector Png
- Cooking Recipes | IDEF0 Diagrams | Cook Png Image
- Conventional and wireless ad hoc network | Design elements ...
- Landscape Plan | Professions - Vector stencils library | Office Layout ...
- Flow chart Example. Warehouse Flowchart | HR department - Vector ...
- Sales symbols - Vector stencils library
- Metropolitan area networks (MAN). Computer and Network Examples
- How to Design Pharmacy Infographics | Pharmacy Illustrations ...
- Png Vector Graphics People
- Professions - Vector stencils library | Flowchart Programming Project ...
- Students Clipart Png
- Vector Characters Png
- Travel and tourism pictograms - Vector stencils library | IVR services ...
- Packaging, loading, customs - Vector stencils library | Conceptual ...
- Post and Mail - Vector stencils library | HR professions - Vector ...
- Icon Cashier Vector White Png
- Radio Waves Image Png
- Instagram Vector Png