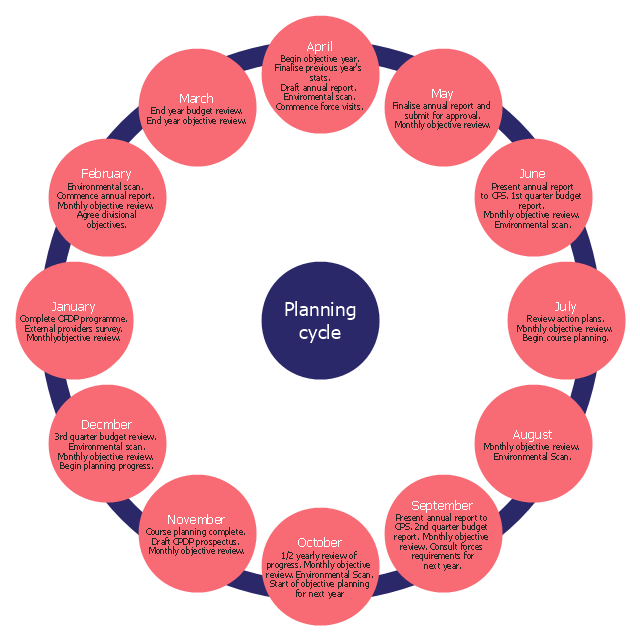
The cycle diagram sample was created on the base of the figure illustrating the webpage "2. POLICY & STRATEGY" of "Scottish Police College Primary Inspection 2006: A Report by Her Majesty's Inspectorate of Constabulary" from the Scottish Government website.
"Strategic Planning.
2.1 The planning process for the College currently follows a structured approach, starting in April and extending through the financial year. The planning cycle is illustrated in figure 2. ...
2.2 The College recognises the need to consult with its customers and stakeholders in the process of setting objectives and directing the training programme. The planning cycle to date refers to force visits, environmental scanning, the course planning process which involves consultation with all forces and other common police services, as well as to a survey of external providers.
2.3 The information from consultation feeds into an EFQM framework from which the College has identified four key policies, namely:
(1) developing and delivering quality training;
(2) developing our people through lifelong learning;
(3) continuous improvement of our service; and
(4) embracing the changing environment.
2.4 The objectives set at divisional level are designed to contribute to delivering these policies. HMIC found that whilst the selected objectives were presented in line with the structure, not all could be considered to meet SMART (Specific, Measurable, Achievable, Relevant and Timed) criteria. This failure indicates that while the process appears suitably structured to deliver a robust result, some of those involved could perhaps have a better understanding of the process." [scotland.gov.uk/ Publications/ 2007/ 02/ 15134652/ 8]
The cycle diagram example "Strategic planning" was created using the ConceptDraw PRO diagramming and vector drawing software extended with the Target and Circular Diagrams solution from the Marketing area of ConceptDraw Solution Park.
www.conceptdraw.com/ solution-park/ marketing-target-and-circular-diagrams
Process Flowchart
The main reason of using Process Flowchart or PFD is to show relations between major parts of the system. Process Flowcharts are used in process engineering and chemical industry where there is a requirement of depicting relationships between major components only and not include minor parts. Process Flowcharts for single unit or multiple units differ in their structure and implementation. ConceptDraw PRO is Professional business process mapping software for making Process flowcharts, Process flow diagram, Workflow diagram, flowcharts and technical illustrations for business documents and also comprehensive visio for mac application. Easier define and document basic work and data flows, financial, production and quality management processes to increase efficiency of your business with ConcepDraw PRO. Business process mapping software with Flowchart Maker ConceptDraw PRO includes extensive drawing tools, rich examples and templates, process flowchart symbols and shape libraries, smart connectors that allow you create the flowcharts of complex processes, process flow diagrams, procedures and information exchange. Process Flowchart Solution is project management workflow tools which is part ConceptDraw Project marketing project management software. Drawing charts, diagrams, and network layouts has long been the monopoly of Microsoft Visio, making Mac users to struggle when needing such visio alternative like visio for mac, it requires only to view features, make a minor edit to, or print a diagram or chart. Thankfully to MS Visio alternative like ConceptDraw PRO software, this is cross-platform charting and business process management tool, now visio alternative for making sort of visio diagram is not a problem anymore however many people still name it business process visio tools.
Sales Process Flowchart Symbols
The most easier way of creating the visually engaging and informative Sales Process Flowchart is to create the new ConceptDraw document and to use the predesigned vector symbols offered in 6 libraries of the Sales Flowchart Solution. There are more than six types of sales process flow diagrams, ConceptDraw PRO software is flowchart maker which include six collections of extended flowchart symbols for effective diagramming. There are main collections of color coded flowchart symbols: Sales Department, Sales Steps, Sales Workflow, Sales Symbols and special set of Sales Arrows and Sales Flowchart.Competitor Analysis
Competitor analysis is a first and obligatory step in elaboration the proper corporate marketing strategy and creating sustainable competitive advantage. Use powerful opportunities of numerous solutions from ConceptDraw Solution Park for designing illustrative diagrams, charts, matrices which are necessary for effective competitor analysis.Sales Process
ConceptDraw PRO is effective software for a variety of activity fields. Now, extended with Sales Flowcharts solution from the Marketing area of ConceptDraw Solution Park it become also useful in the field of sales. It helps to design professional looking Sales Flowcharts, Sales Process Flowcharts, Sales Process Maps, Plans and Diagrams to effectively realize the process of selling a product or service, and to display the sales results.Agile Methodology
Agile methodology is an excellent alternative to waterfall and traditional sequential development. ConceptDraw PRO software extended with SCRUM Workflow solution is ideal for quick and easy designing various diagrams, charts, mind maps and schematics illustrating software development using Agile methodologies, and in particular Scrum methodology.Quality Management System
ConceptDraw PRO diagramming and vector drawing software extended with Total Quality Management (TQM) Diagrams solution from the Quality area of ConceptDraw Solution Park perfectly suits for development and visually representing a Quality Management System.Scrum
What is Scrum? Scrum is the famous agile software development methodology which depicts an iterative and incremental approach for the work on the complex projects. Use ConceptDraw PRO diagramming and vector drawing software extended with SCRUM Workflow solution to draw various types of professional-looking Scrum Charts, Scrum Workflow Diagrams, Scrum Mind Maps, Scrum boards and attractive Scrum Infographics.Structured Systems Analysis and Design Method (SSADM) with ConceptDraw PRO
Structured Systems Analysis and Design Method (abbr. SSADM) is a method developed in Great Britain and accepted in 1993 as a national standard for information systems development and analysis. SSADM is based on Data Flow Diagrams and is characterized with presence of clear sequence of steps at projecting, analysis, and documenting of information system. It involves 6 main stages: analysis of existing system or estimation of practicability, requirements definition, determination of technical requirements and equipment cost, development of logical data model, projecting of logical requirements and specification them, physical projecting. Each of them is also divided into several steps defining the tasks that should be fulfilled at a given stage. The most important SSADM elements are flows modeling with help of DFD, data logic modeling with help of LDS (Logical Data Structure) and description of entities behavior. Applying of SSADM is easy with ConceptDraw PRO diagramming and vector drawing software and Data Flow Diagram solution.Marketing Charts
ConceptDraw PRO diagramming and vector drawing software offers the Marketing Diagrams Solution from the Marketing Area with extensive drawing tools, predesigned vector shapes, templates and samples for fast and easy drawing marketing charts and diagrams, marketing schemes and flow charts, various marketing illustrations, etc.Genomics
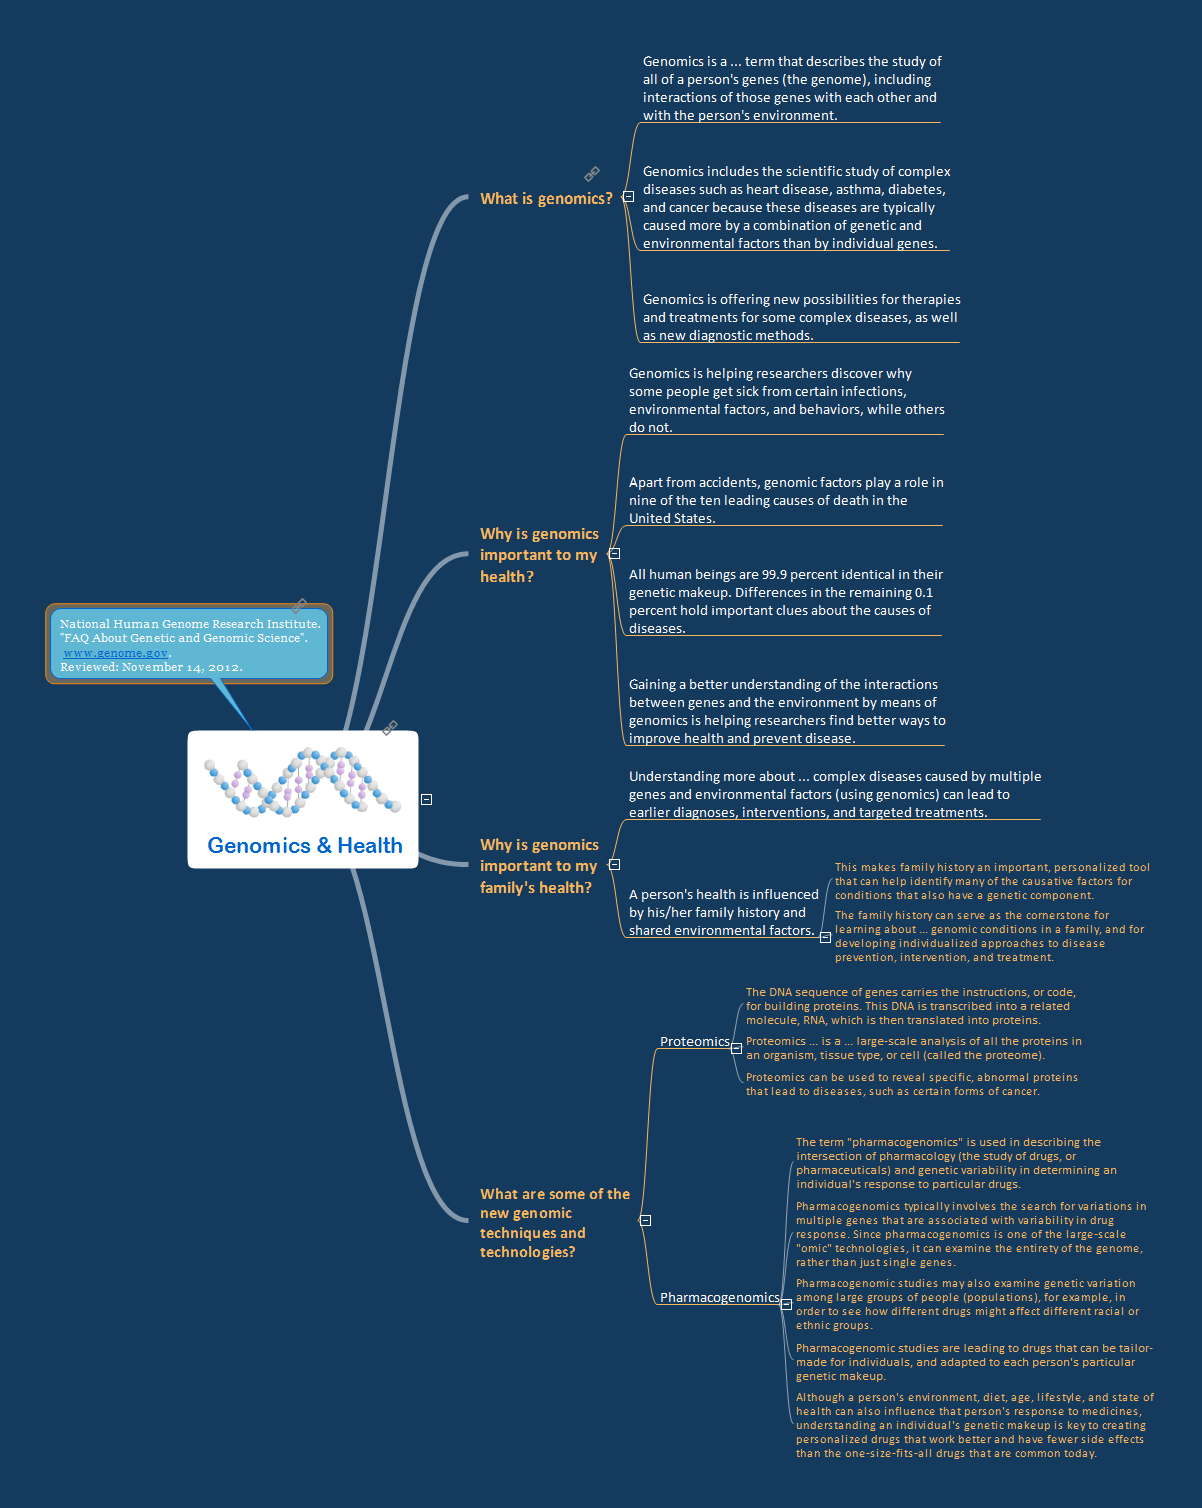
Genomics is a section of molecular genetics devoted to the study of genome and genes of living organisms. The human's genome is a totality of inheritable material that is enclosed in a person's cell. The main task of genomics is the establishment of a complete genetic characterization of the whole cell, definition the number of contained genes and their sequences, number of nucleotides in each gene and their sequences, the functions of each gene in relation to the metabolism of an organism. Genomics allows to express the essence of an organism, its potential opportunities, generic and individual differences from other organisms, to anticipate the reaction to the external impacts, knowing the sequence of nucleotides in each of genes and number of genes. Genetic engineering rapidly moves, the new discoveries and achievements in this field occur in incredibly fast pace. This Mind Map represents the list of FAQs about genetic and genomic science, and illustrates how useful are the Mind Maps for structuring information and explaining the complex subjects in a simplified manner. ConceptDraw MINDMAP lets you easy create Mind Map representing the main thesises for any science.- Successful Strategic Plan | Strategic planning - Cycle diagram ...
- Strategic planning - Cycle diagram | Successful Strategic Plan ...
- Strategic planning - Cycle diagram | Water cycle diagram | Process ...
- Strategic planning - Cycle diagram | Strategic planning cycle - Arrow ...
- Strategic planning - Cycle diagram
- BPR Diagram . Business Process Reengineering Example | Strategic ...
- Strategic planning - Cycle diagram | Water cycle diagram | BPM life ...
- Strategic Planning Cycle Diagram And Explanation
- Strategic planning - Cycle diagram
- Successful Strategic Plan | Strategic planning - Cycle diagram ...
- Strategic planning - Cycle diagram | Strategic planning cycle - Arrow ...
- Diagram Of Process In Cycle
- Program assessment plan - Arrow circle diagram | Strategic ...
- Successful Strategic Plan | Strategic planning - Cycle diagram ...
- Successful Strategic Plan | Strategic planning cycle - Arrow loop ...
- Strategic planning - Cycle diagram | Organizational Structure ...
- Strategic planning - Cycle diagram
- Strategic planning - Cycle diagram | ConceptDraw Solution Park ...
- Strategic planning - Cycle diagram | BPR Diagram . Business ...
- Water cycle diagram | Strategic planning - Cycle diagram ...


