HelpDesk
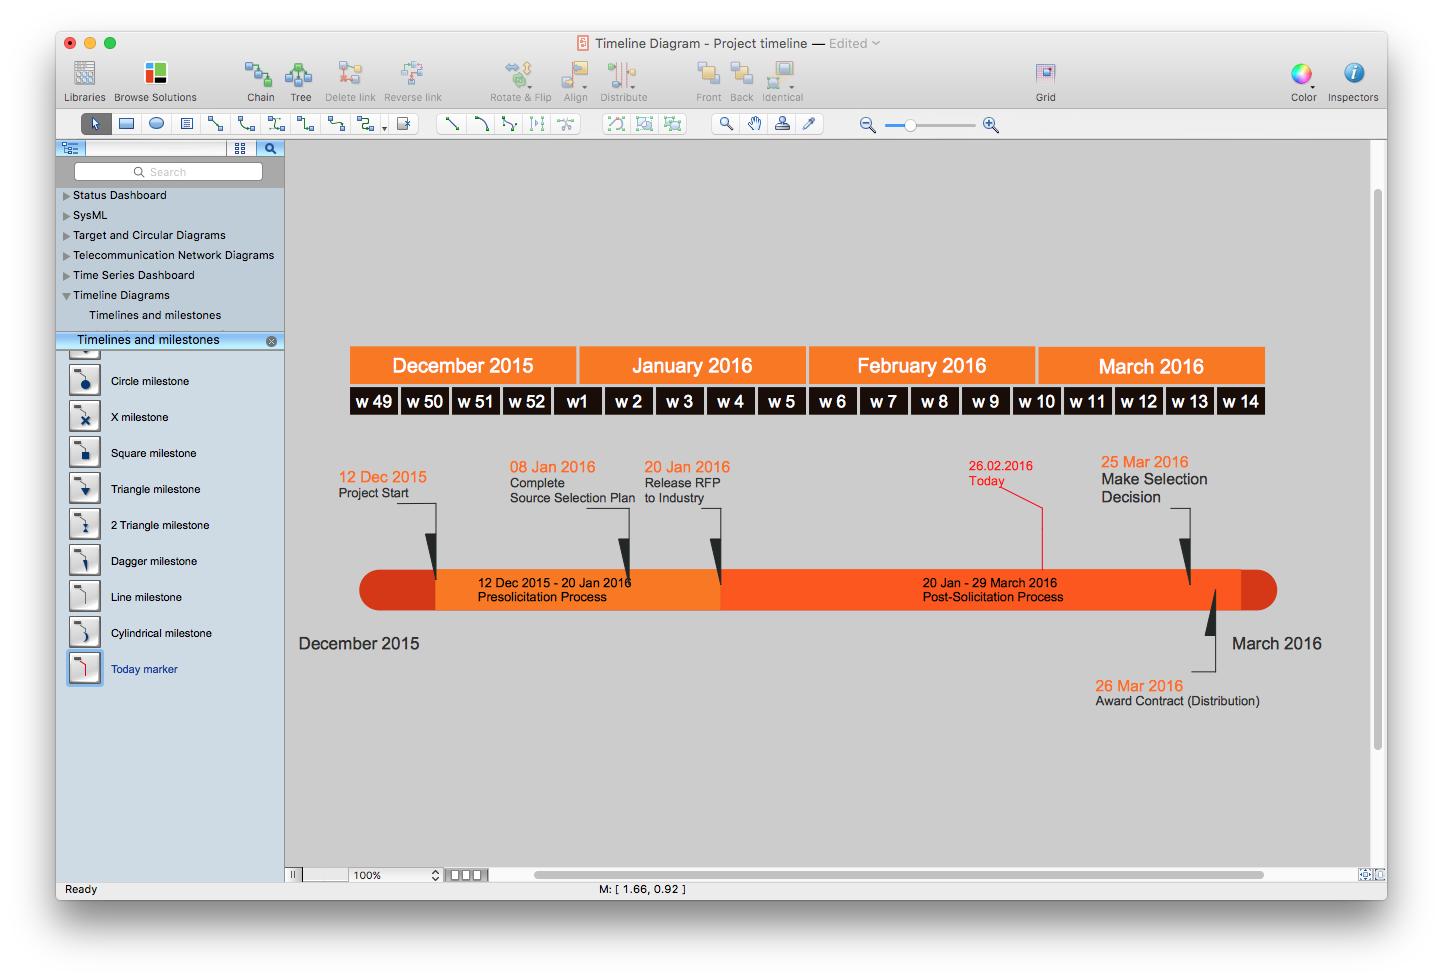
How to Create a Timeline Diagram in ConceptDraw PRO
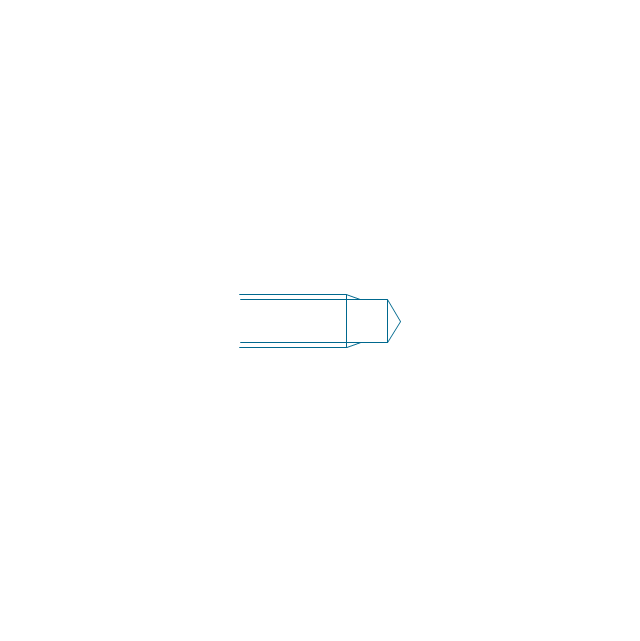
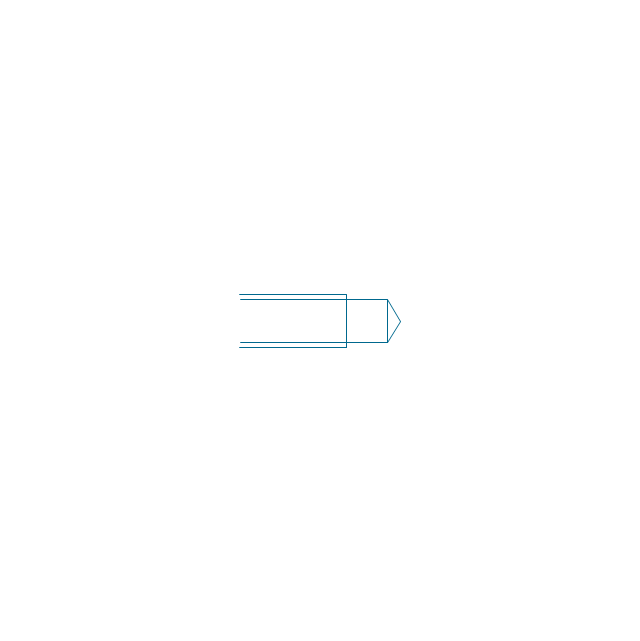
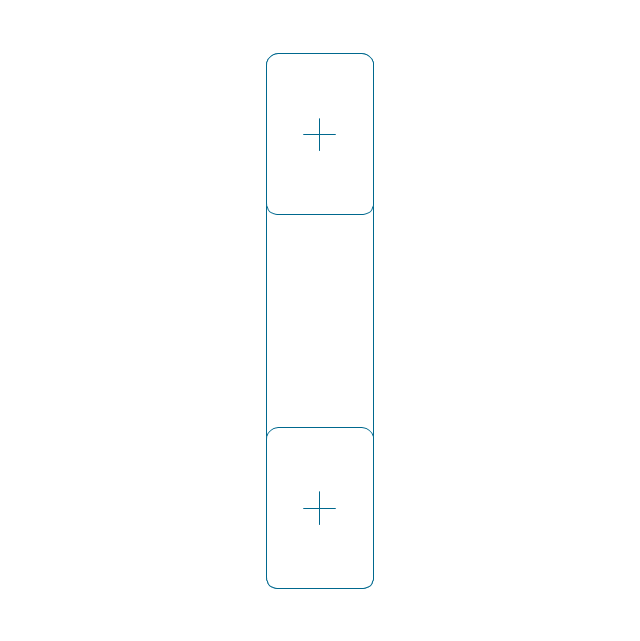
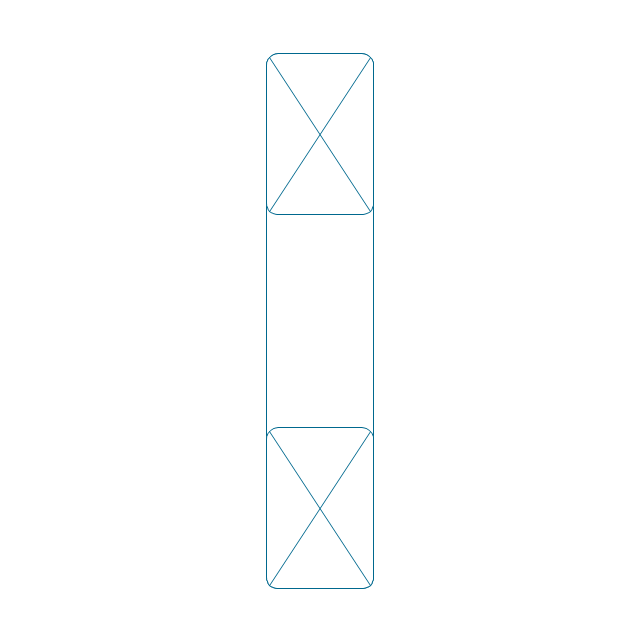
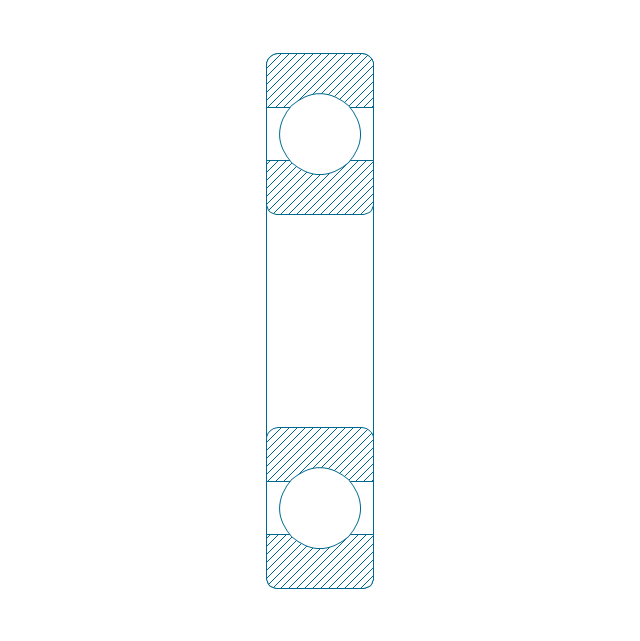
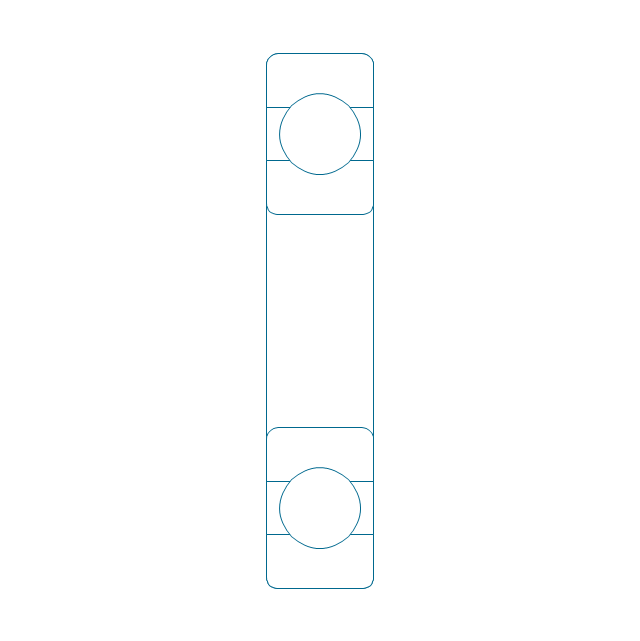
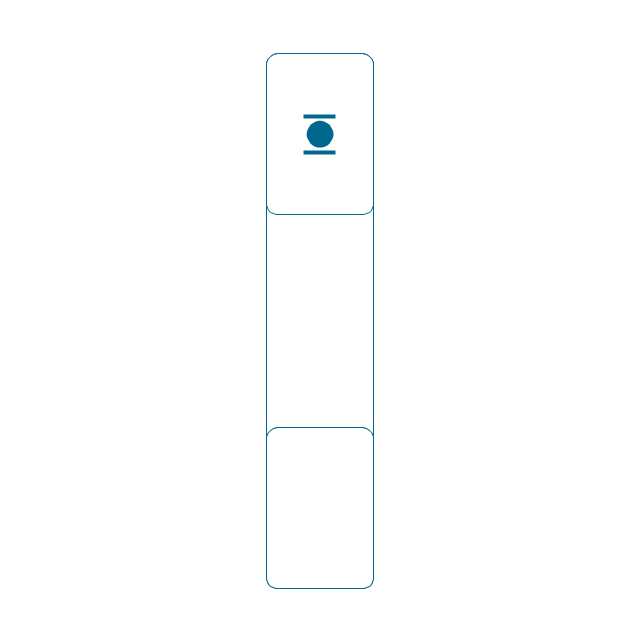
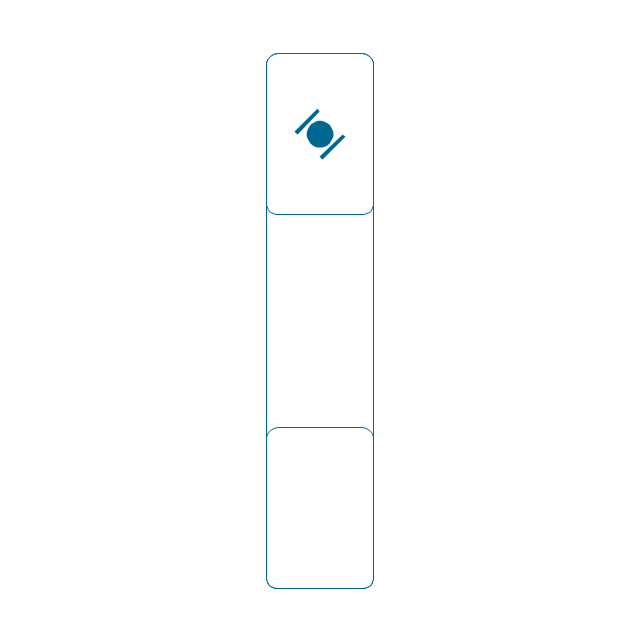
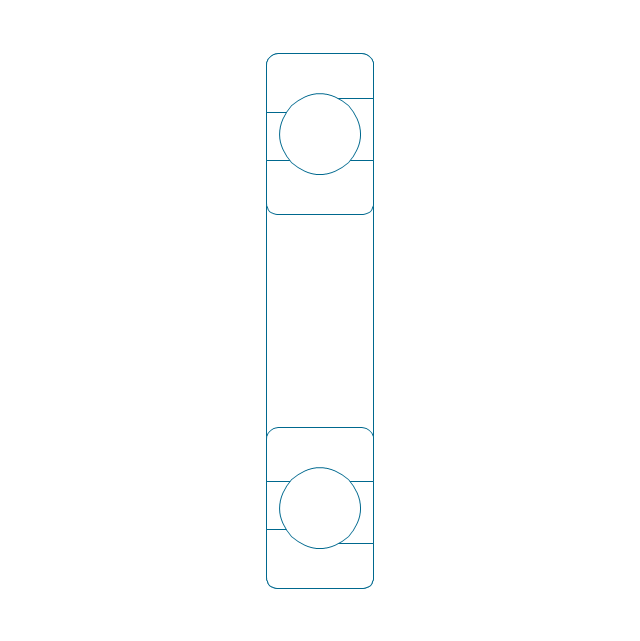
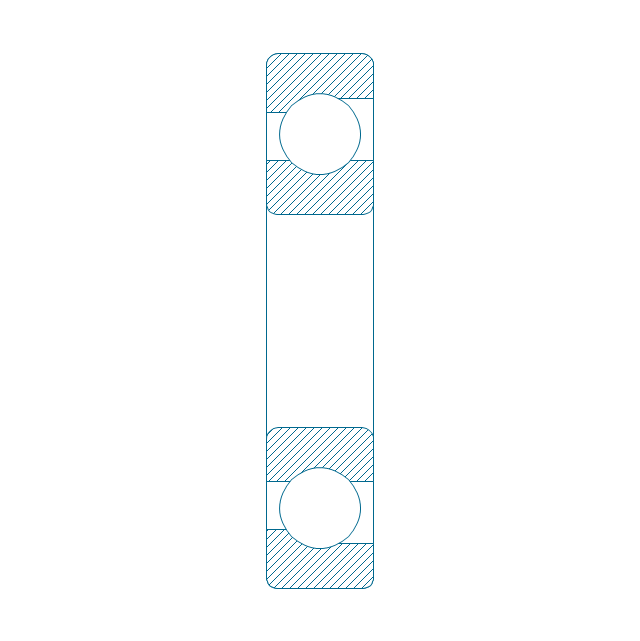
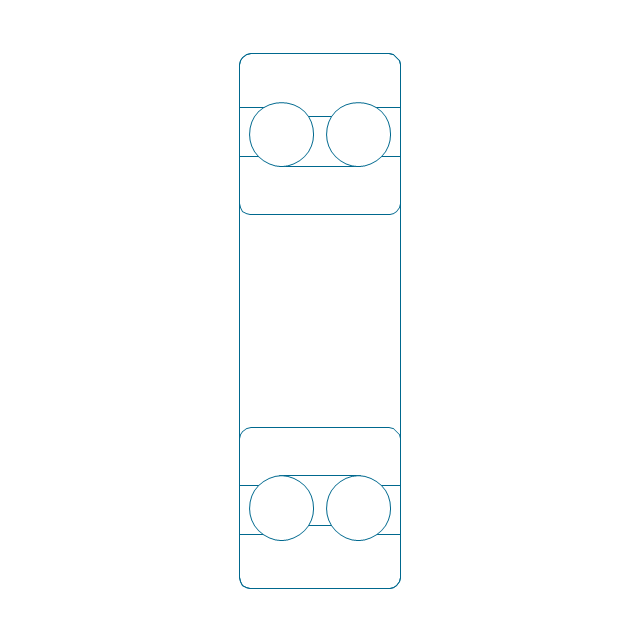
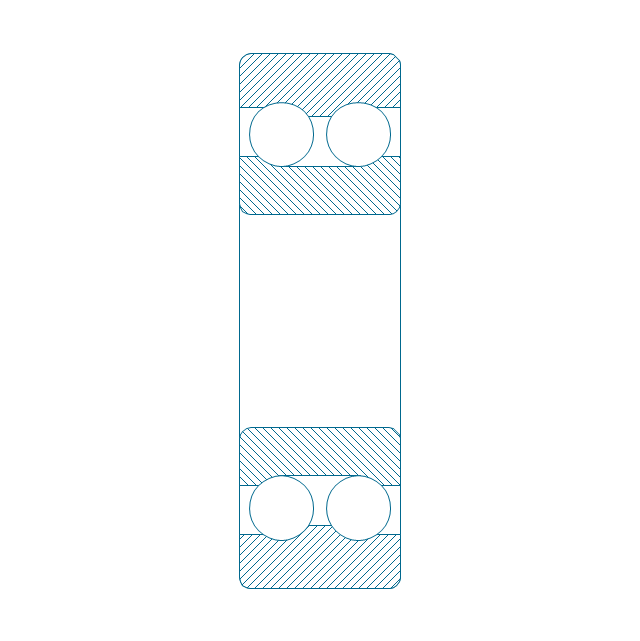
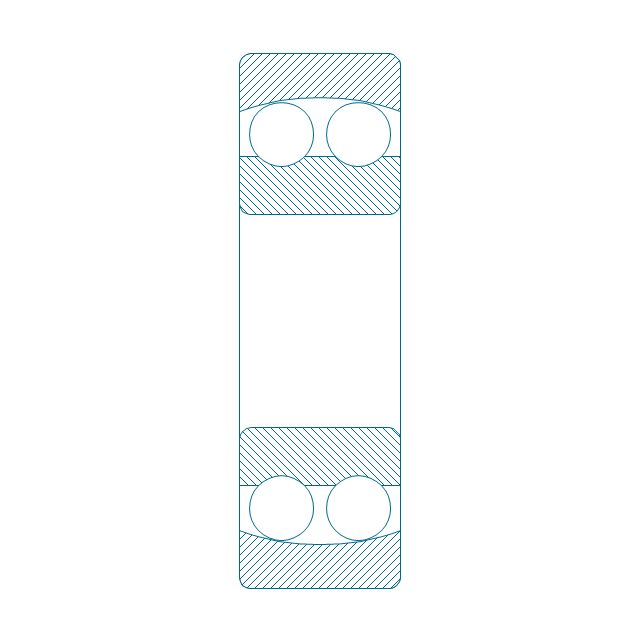
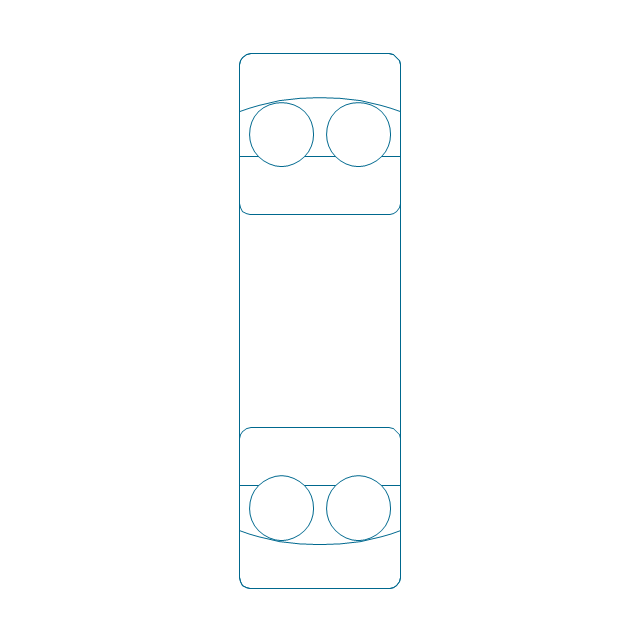
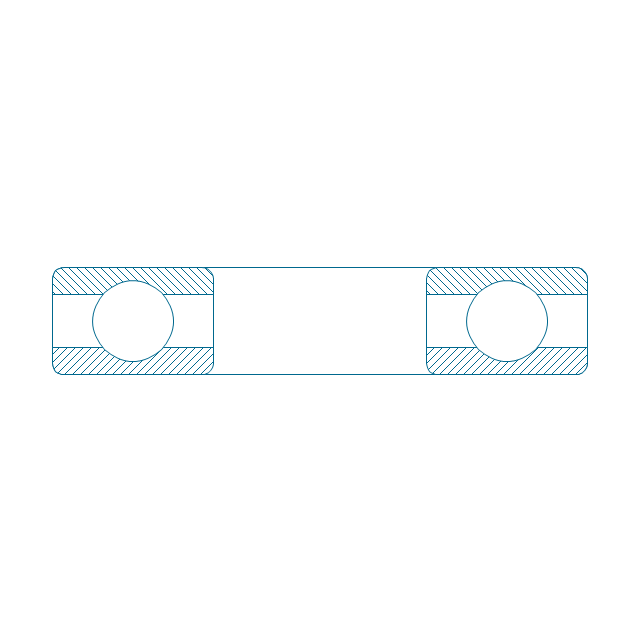
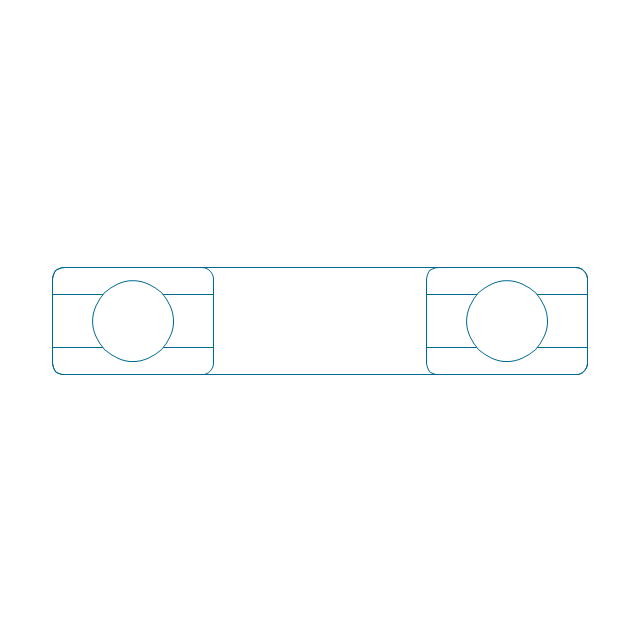
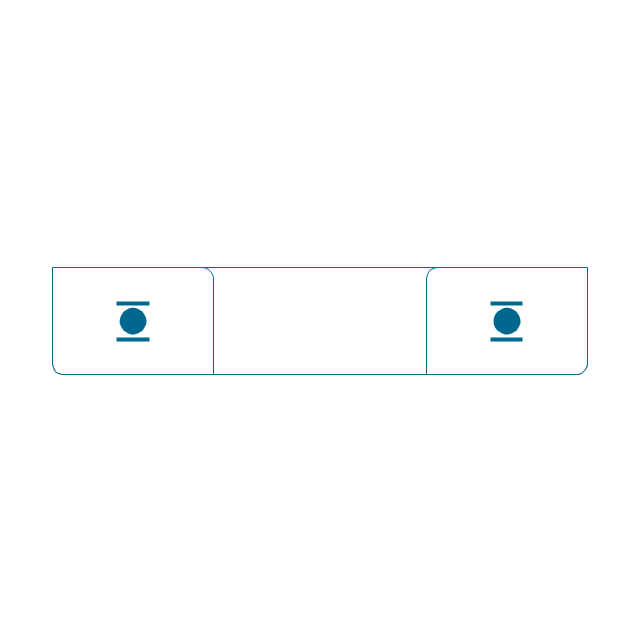
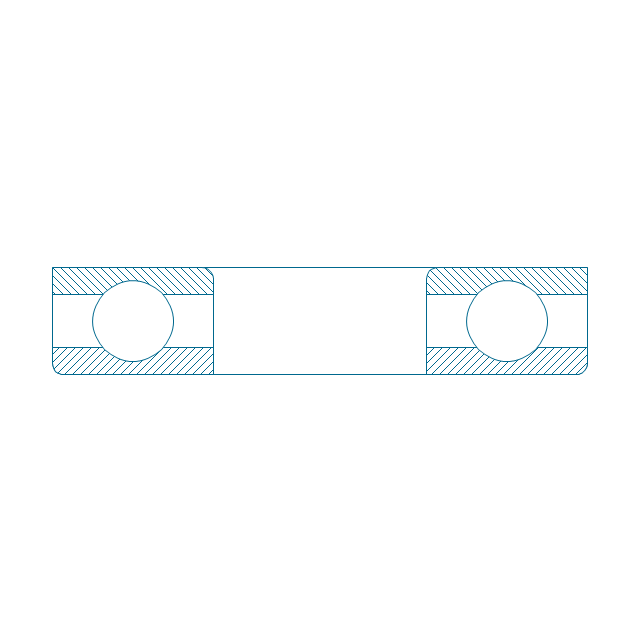
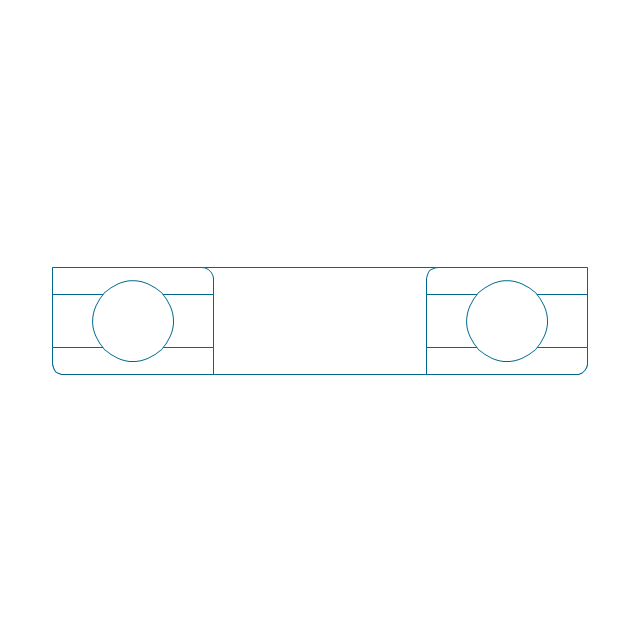
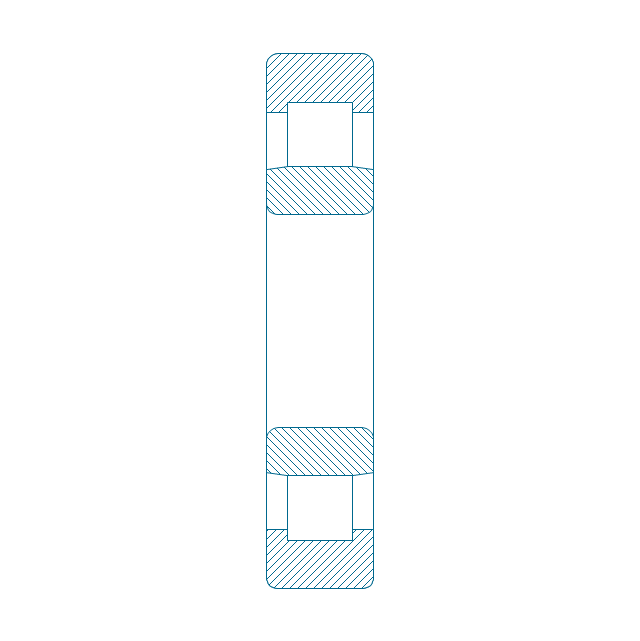
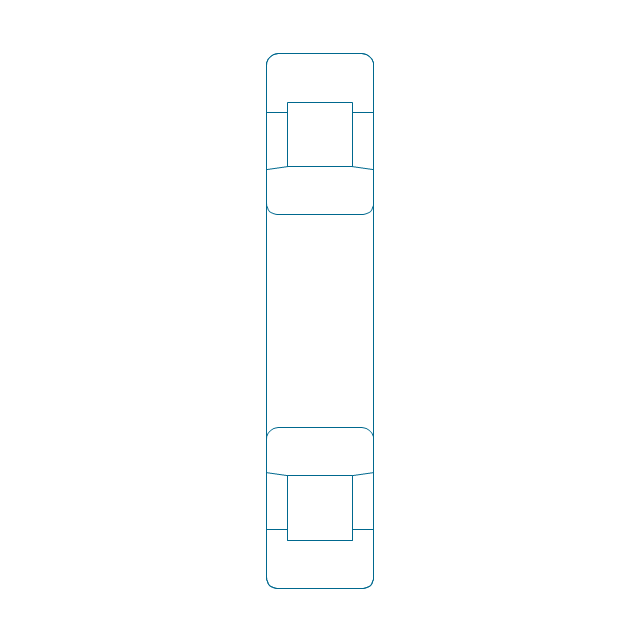
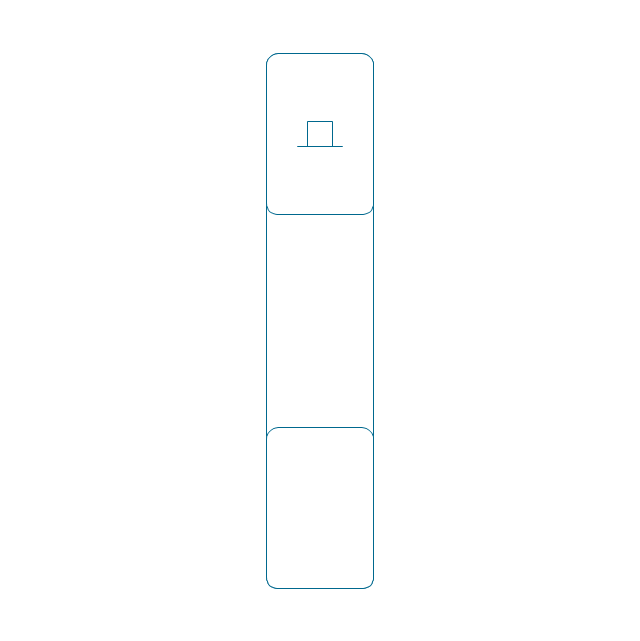
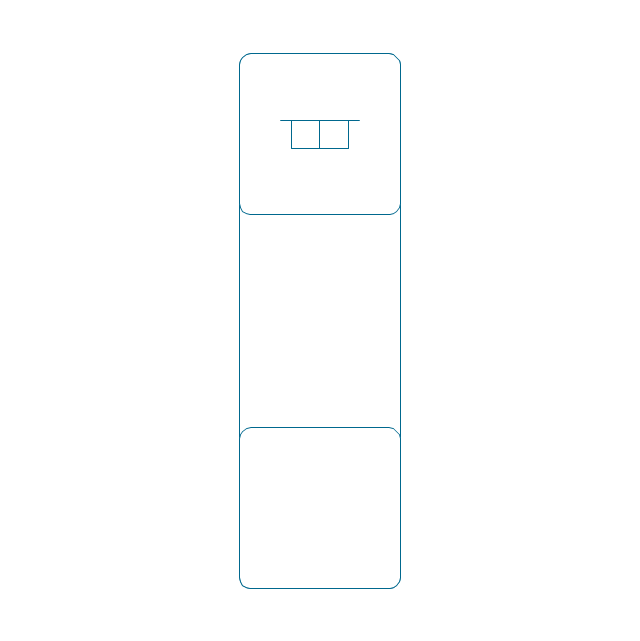
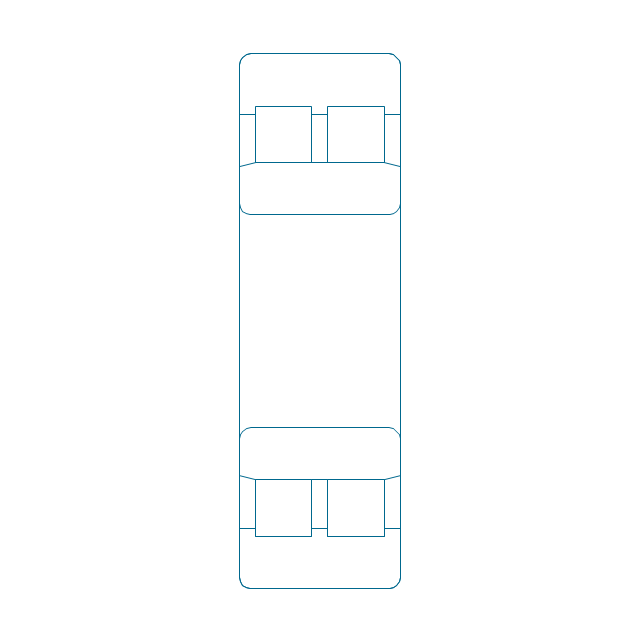
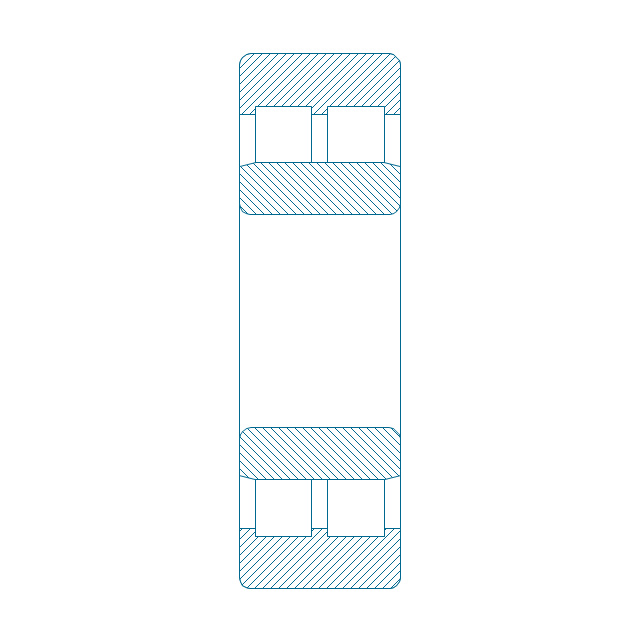
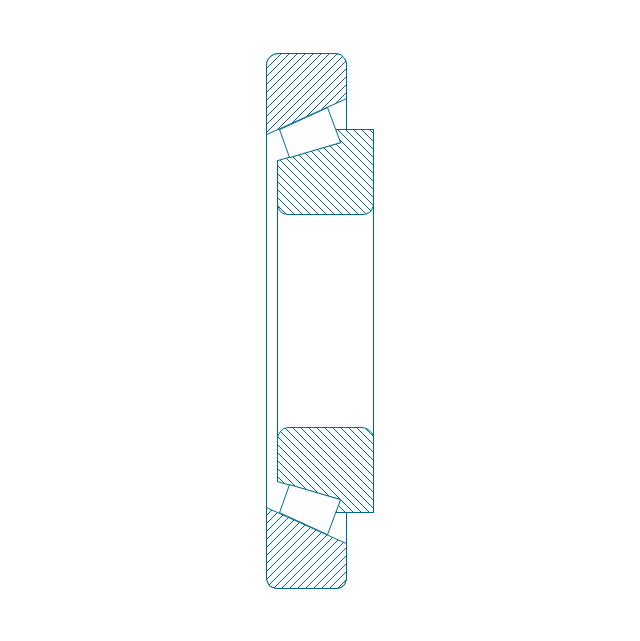
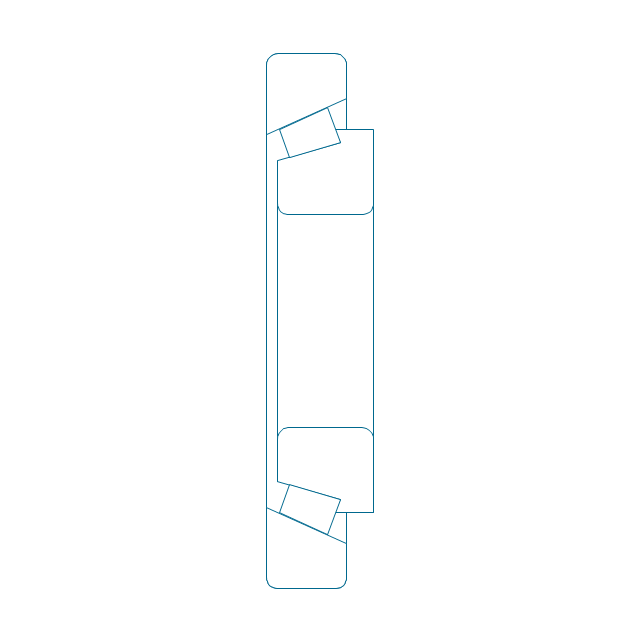
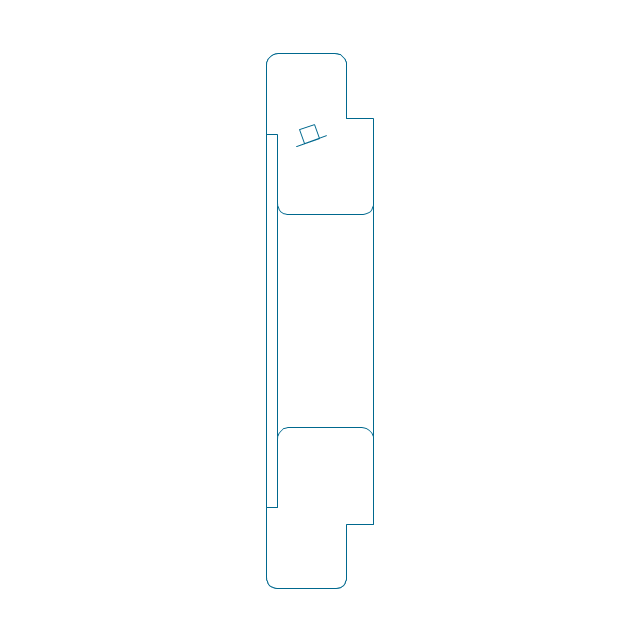
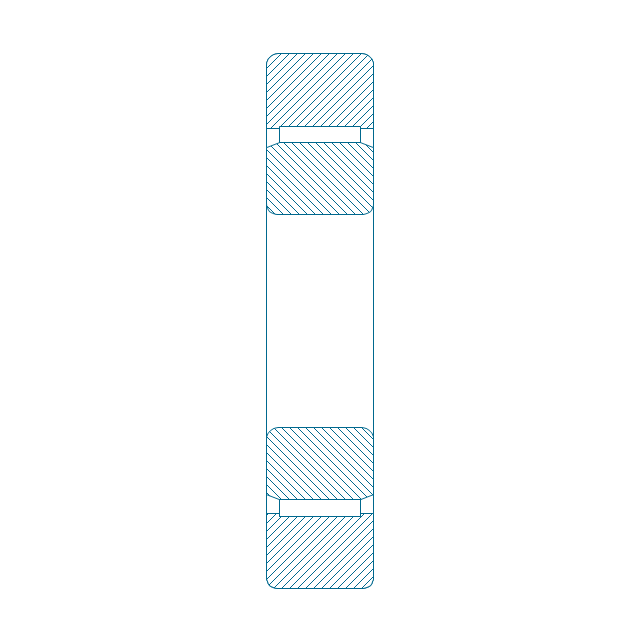
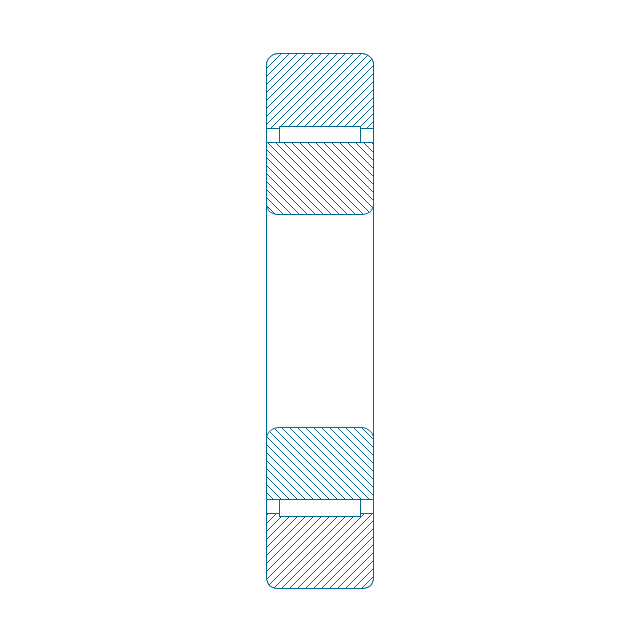
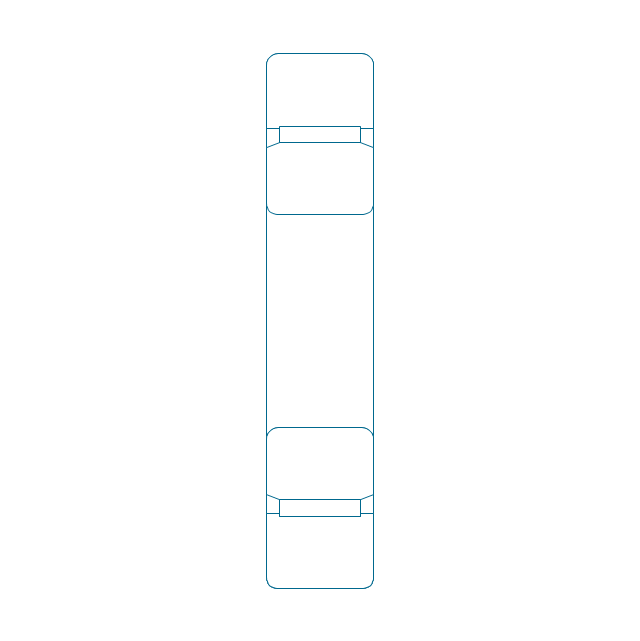
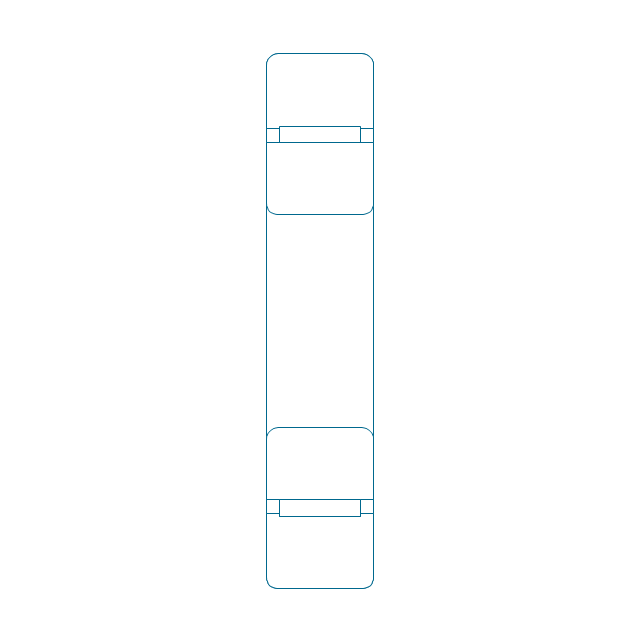
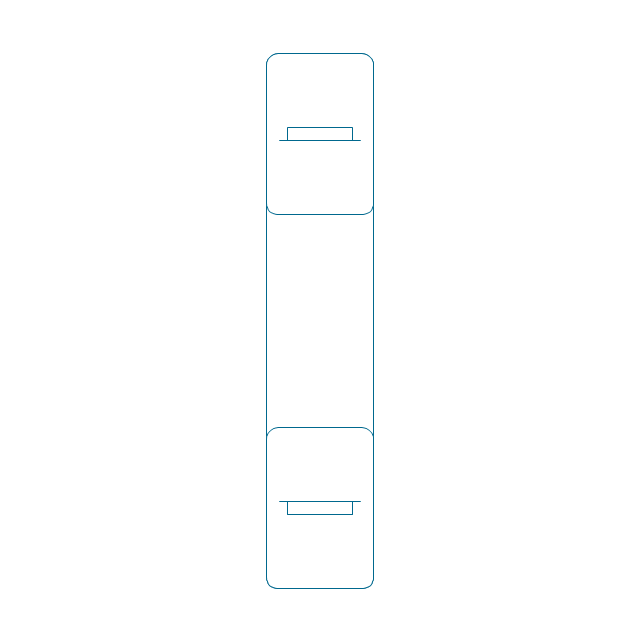
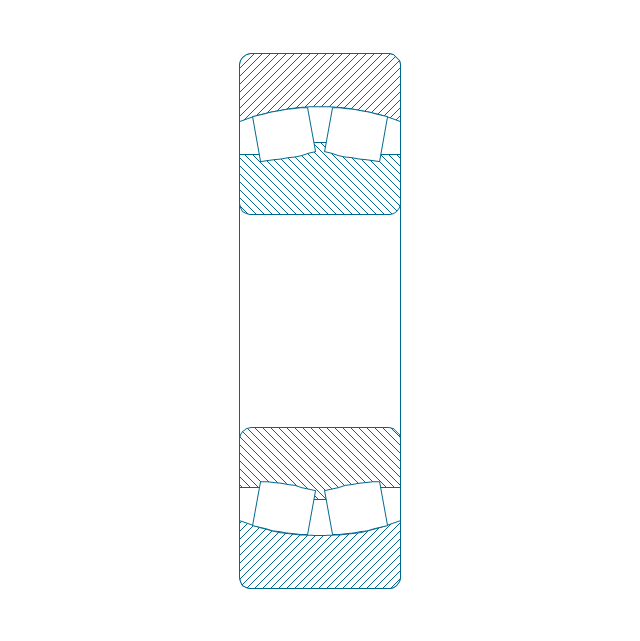
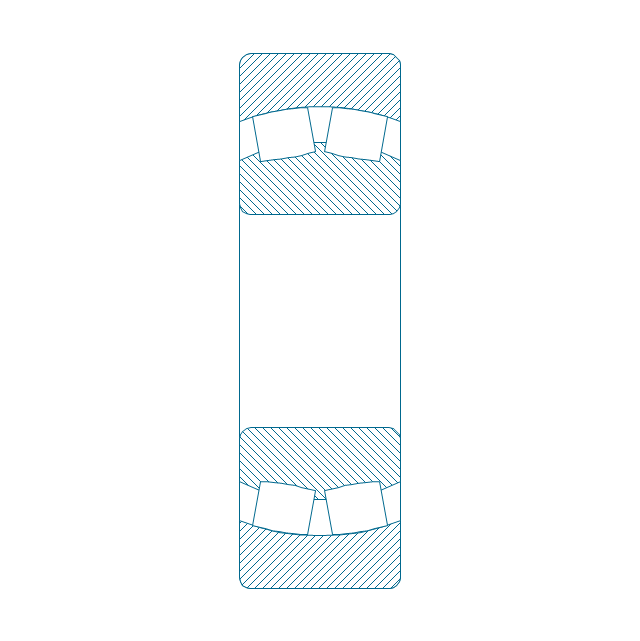
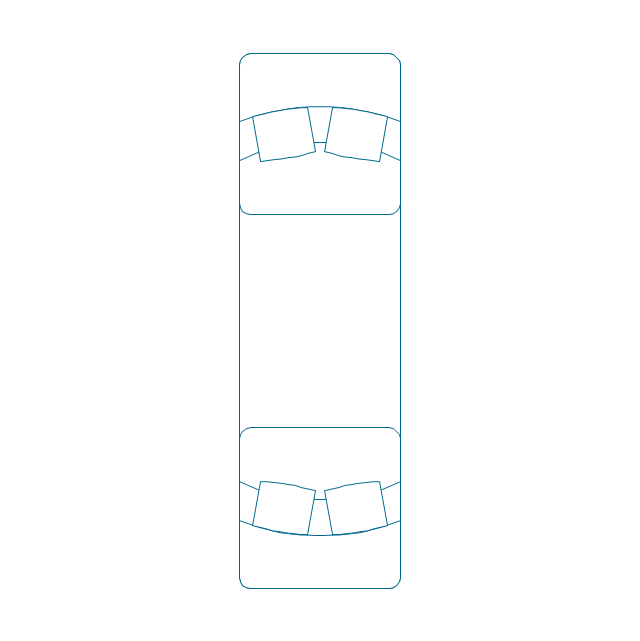
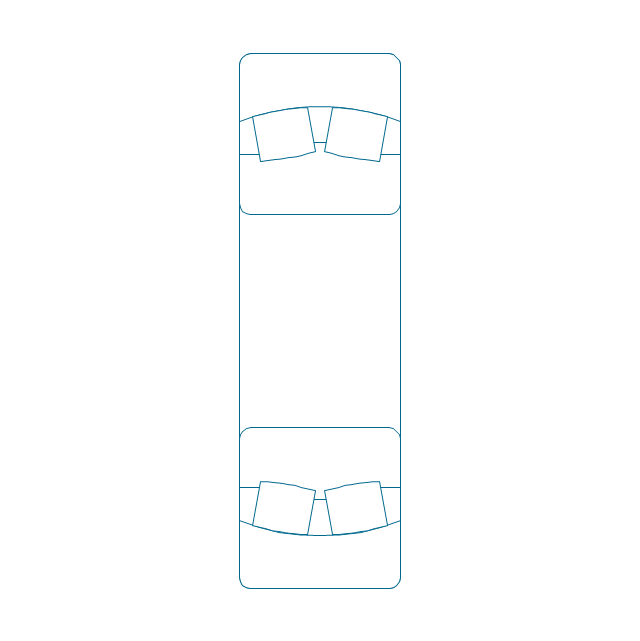
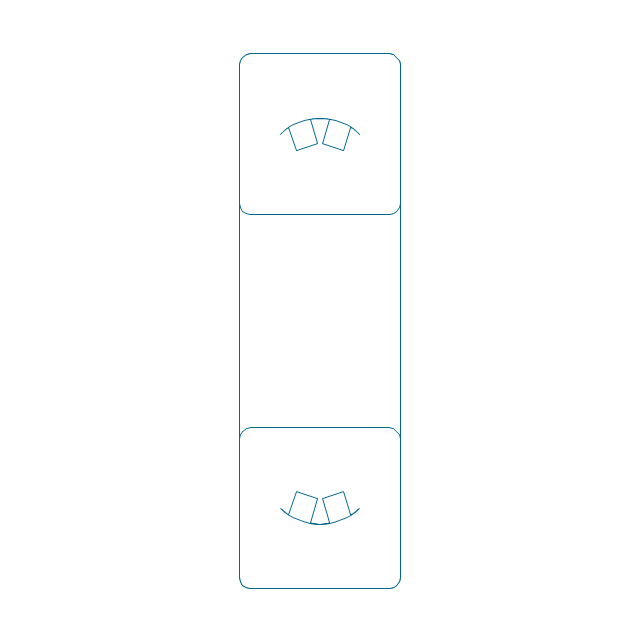
A Timeline is a chart which displays a project plan schedule in chronological order. A Timeline is used in project management to depict project milestones and visualize project phases, and show project progress. The graphic form of a timeline makes it easy to understand critical project milestones, such as the progress of a project schedule. Timelines are particularly useful for project scheduling or project management when accompanied with a Gantt chart. It captures the main of what the project will accomplish and how it will be done. making a project timeline is one of the most important skills a project manager needs have. Making comprehensive, accurate timelines allows you getting every project off in the best way. ConceptDraw PRO allows you to draw a timeline charts using special library.The vector stencils library "Bearings" contains 59 symbols of ball bearings, roller bearings, shafts, springs, gears, hooks, spindles, and keys.
Use it to design engineering drawings of machine tools and mechanical devices in the ConceptDraw PRO diagramming and vector drawing software extended with the Mechanical Engineering solution from the Engineering area of ConceptDraw Solution Park.
www.conceptdraw.com/ solution-park/ engineering-mechanical
HelpDesk
How to Create a Bar Chart in ConceptDraw PRO
Bar charts (bar graphs) are diagrams displaying data as horizontal or vertical bars of certain heights.Bar charts are widely used to show and compare the values of the same parameters for different data groups.
The bar graph can be vertical or horizontal. This depends on the amount of categories. There are many methods in which bar graph can be built and this makes it a very often used chart type. Usually, a bar chart is created so that the bars are placed vertically. Such arrangement means that the bar's height value is proportional to the category value. Nevertheless, a bar chart can be also drawn horizontally. This means that the longer the bar, the bigger the category. Thus, a bar chart is a good way to present the relative values of different measured items. The ConceptDraw Bar Graphs solution allows you to draw a bar chart quickly using a vector library, containing the set of various bar charts objects.
How to Create a Column Chart
The question how to create a column chart have a simple answer. Use ConceptDraw tips to find out how to create a column chart depicts your data the best way.Chart Maker for Presentations
Easy charting software comes with beautiful chart templates and examples. This makes it easy to create professional charts without prior experience.How to Create a Bar Chart
The answer how to create a bar chart can be found in ConceptDraw software. The simple tips guide you through the software to quickly learn how to create a bar chart.Chart Templates
Easy charting software comes with beautiful chart templates and examples. This makes it easy to create professional charts without prior experience.Chart Examples
Easy charting software comes with beautiful chart templates and examples. This makes it easy to create professional charts without prior experience.- Symbol Sketch Of Cylindrical
- Gib Head Key Symbol In Technical Drawing
- Bearings - Vector stencils library | Symbol Of Gib Head Key
- Joining Cylindrical Pipes Welding Sketch
- Mechanical Drawing Symbols | Design elements - Bearings ...
- Bearing Symbol
- Mechanical Drawing Symbols | Bearings - Vector stencils library ...
- Mechanical Drawing Symbols | Design elements - Bearings ...
- Angular Contact Ball Bearing Symbols
- Angular Contact Bearing Symbols
- Mechanical Drawing Symbols | Design elements - Bearings ...
- Welding symbols | How To Draw Building Plans | Piping and ...
- Mechanical Drawing Symbols | Design elements - Bearings | Create ...
- Mechanical Drawing Symbols | Mechanical Engineering | Design ...
- How to Create a Timeline Diagram in ConceptDraw PRO | Timeline ...
- Electrical Symbols — Electrical Circuits | Bearings - Vector stencils ...
- Mechanical Drawing Symbols | Engineering | Process Flowchart ...
- Mechanical Drawing Symbols | Process Flow Diagram Symbols ...
- Mechanical Drawing Symbols | Design elements - Bearings ...
- Mechanical Drawing Symbols | Building Drawing Software for ...



-bearings---vector-stencils-library.png--diagram-flowchart-example.png)
-bearings---vector-stencils-library.png--diagram-flowchart-example.png)
-bearings---vector-stencils-library.png--diagram-flowchart-example.png)


-bearings---vector-stencils-library.png--diagram-flowchart-example.png)






-bearings---vector-stencils-library.png--diagram-flowchart-example.png)
