HelpDesk
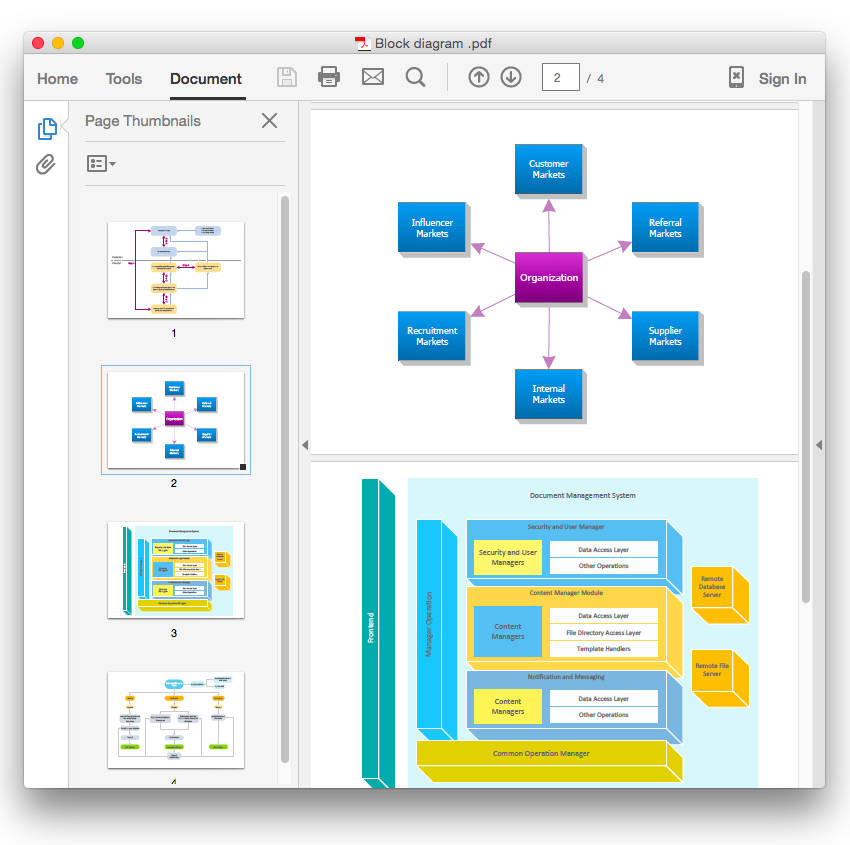
How To Convert a Block Diagram to Adobe PDF Using ConceptDraw PRO
ConceptDraw PRO allows you to easy share your business documentation between different computers with different operating systems and applications using it's export capabilities.You can get clear business graphic pack in pdf format and avoid any problems while communicating it with stakeholders.HelpDesk
How to Create Management Infographics Using ConceptDraw PRO
Management might want to communicate a basic workflow for each division of the company, visualise business strategy and decision processes, or display a certain business training concept. In this case, an infographic can be more text heavy, and use illustrations to establish a timeline, process, or step-by-step sequence of events. ConceptDraw PRO can be used as a tool for creating management infographics. It allows you to draw infographics quickly and easily using the special templates and vector stencils libraries. Infographics can be used to quickly communicate a message, to simplify the presentation of large amounts of data, to see data patterns and relationships, and to monitor changes in variables over time. It can contain bar graphs, pie charts, histograms, line charts, e.t.c.HelpDesk
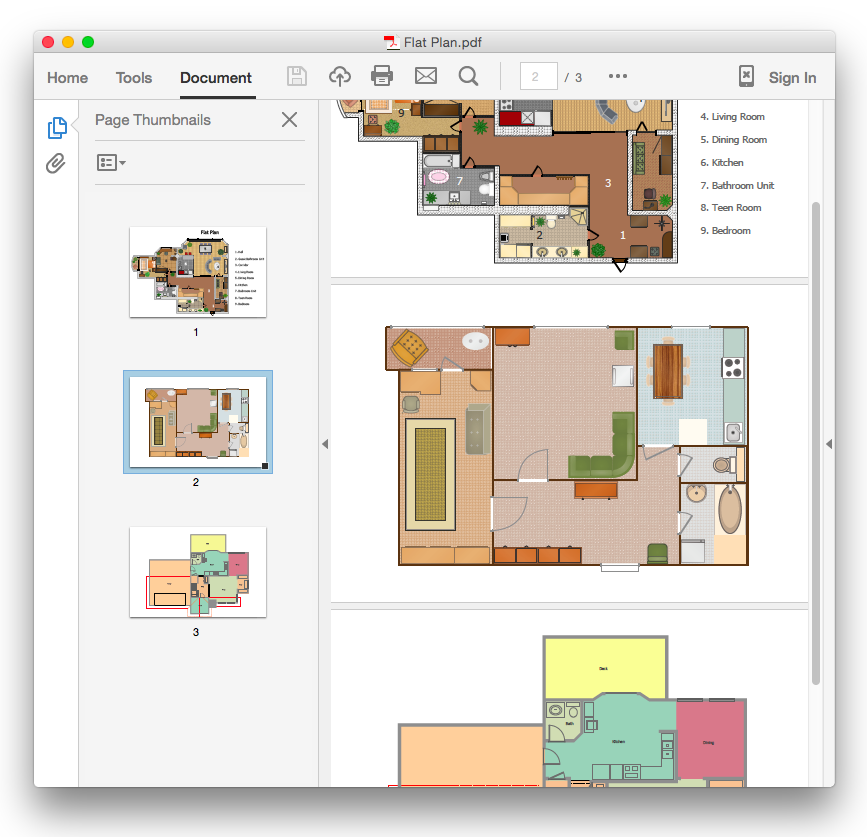
How To Convert a Floor Plan to Adobe PDF Using ConceptDraw PRO
ConceptDraw PRO allows you to easy share your building plans between different computers with different operating systems and applications using it's export capabilities.You can get clear floor plan in pdf format and avoid any problems while communicating it with your Customers and Contractors.
 Venn Diagrams
Venn Diagrams are actively used to illustrate simple set relationships in set theory and probability theory, logic and statistics, mathematics and computer science, linguistics, sociology, and marketing. Venn Diagrams are also often used to visually summarize the status and future viability of a project.
 ATM UML Diagrams
The ATM UML Diagrams solution lets you create ATM solutions and UML examples. Use ConceptDraw PRO as a UML diagram creator to visualize a banking system.
 Target and Circular Diagrams
This solution extends ConceptDraw PRO software with samples, templates and library of design elements for drawing the Target and Circular Diagrams.
 Entity-Relationship Diagram (ERD)
An Entity-Relationship Diagram (ERD) is a visual presentation of entities and relationships. That type of diagrams is often used in the semi-structured or unstructured data in databases and information systems. At first glance ERD is similar to a flowch
Flowchart Software
The Flowcharts are popular and widely used for designing, documenting, managing and analyzing the complex processes and programs in various fields, such as science, business, engineering, architecture, manufacturing, administration, and many others. To design professional looking Flowchart Diagrams we recommend to use the ConceptDraw PRO diagramming and vector drawing software extended with set of Flowchart maker solutions from the What is a Diagram, Finance and Accounting, Marketing, and Business Processes areas of ConceptDraw Solution Park. ConceptDraw PRO flowchart software is rich for the libraries of ready-to-use predesigned vector flowchart objects, templates, samples and examples, which make it the best choice for designing the Flowcharts of any type and style. Besides, the ConceptDraw documents with Flowchart Diagrams are vector graphic documents, available for reviewing, modifying and converting to different popular formats: image, HTML, PDF file, MS PowerPoint Presentation, Adobe Flash or MS Visio XML.
 Soccer
The Soccer (Football) Solution extends ConceptDraw PRO v9.5 (or later) software with samples, templates, and libraries of vector objects for drawing soccer (football) diagrams, plays schemas, and illustrations. It can be used to make professional looking
 Business Process Workflow Diagrams
The Business Process Workflow Diagrams solution enhances the ConceptDraw PRO v10 functionality with predesigned examples, samples and a numerous collection of predesigned vector objects of workflow chart elements, icons, arrows, connectors, and varied wor
 Business Process Diagrams
The Business Process Diagram Solution extends ConceptDraw PRO v10 BPMN software with its RapidDraw interface, templates, samples, and libraries based on the BPMN 1.2 and BPMN 2.0 standards. This powerful solution permits you to visualize easily both simple and complex processes, as well as design business models. The Business Process Diagram solution allows one to quickly develop and document in detail any business processes at any stage of a project’s planning and implementation.
Gantt Chart Templates
Gantt Chart Templates - PM Easy Solution from the Project Management Area extends ConceptDraw PROJECT with the ability to quickly start a project. It lists task dependencies and relationships making the terative planning easy. ConceptDraw PROJECT lets you the useful possibility to create visual project dashboards and diagrams, generate various kinds of reports with one click. It provides also extensive capabilities of importing and exporting in various formats: Microsoft Project, ConceptDraw MINDMAP, Mindjet MindManager, PDF file.
 Azure Architecture
Create Microsoft Azure architecture diagrams using icons and templates regarding Azure management, Azure storage and Azure services.
 IDEF Business Process Diagrams
Use the IDEF Business Process Diagrams solution to create effective database designs and object-oriented designs, following the integration definition methodology.
Relative Value Chart Software
Relative value is a value measured in the terms of liquidity, risks, return of one investment or financial instrument relative to another. Relative values are widely used in:business, economics, investment, management, marketing, statistics, etc. ConceptDraw PRO software is the best for drawing professional looking Relative Value Charts. ConceptDraw PRO provides Divided Bar Diagrams solution from the Graphs and Charts Area of ConceptDraw Solution Park.- Facebook Project Use Case Diagram Pdf
- Management Information Systems Pyramid Pdf
- UML Use Case Diagram Example Social Networking Sites Project ...
- Pdf Gantt Chart
- Bar Chart Pdf
- Window Room Wall Venn Diagram
- Basic Flowchart Symbols and Meaning | Data Flow Diagram | Data ...
- Mechanical Drawing Symbols Chart Pdf
- Conversion Of Graphics Pie Chart Pdf
- How To Convert a Computer Network Diagram to Adobe PDF Using ...
- ConceptDraw Dashboard for Facebook | UML Use Case Diagram ...
- 3 Circle Venn. Venn Diagram Example | Gantt Chart Templates | 3 ...
- Business Productivity Diagramming | Cause and Effect Diagram ...
- IDEF0 Diagrams | Data Flow Diagrams (DFD) | Management ...
- Line Graph Bar Chart Pie Chart With Solve Pdf File
- Pic Pie Chart And Bar Chart Pdf File
- Pie Chart Designing Process Pdf
- Block Diagram The Process Of Business Communication
- Process Flowchart | Enterprise architecture diagram | Enterprise ...
- How to Create a Social Media DFD Flowchart | How to Create an ...


