Data Visualization Solutions

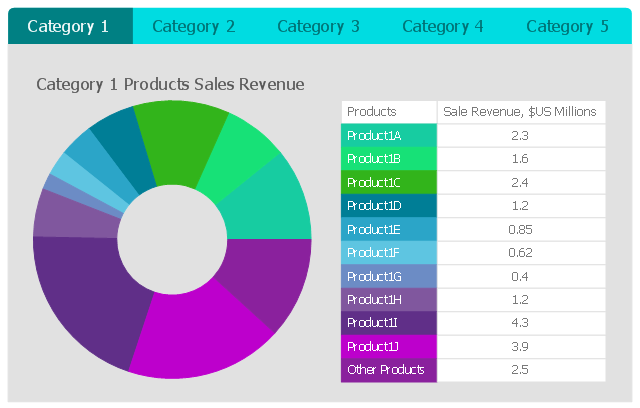
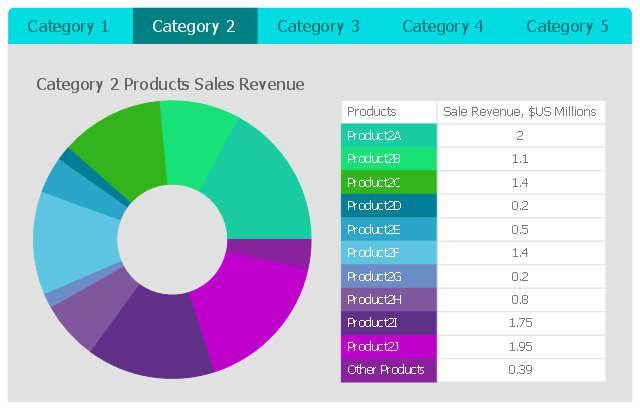
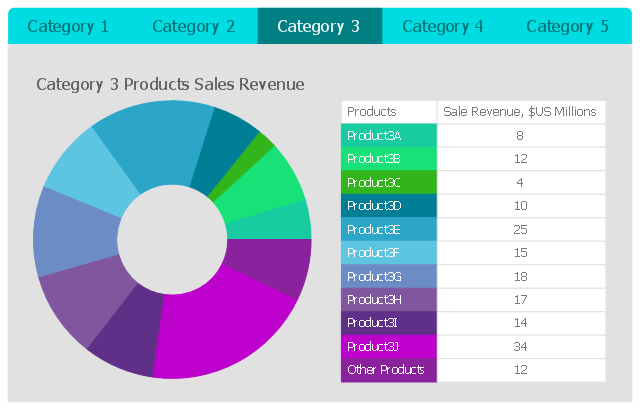
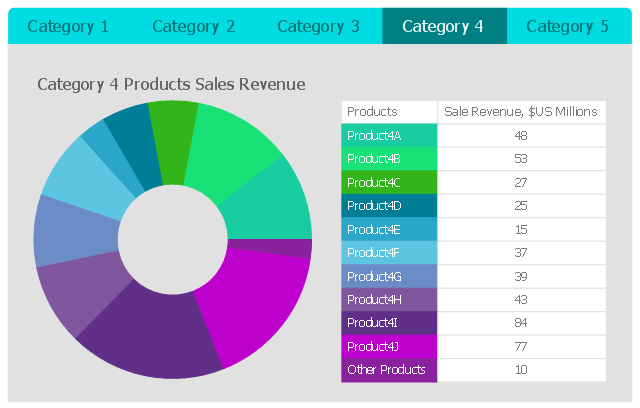
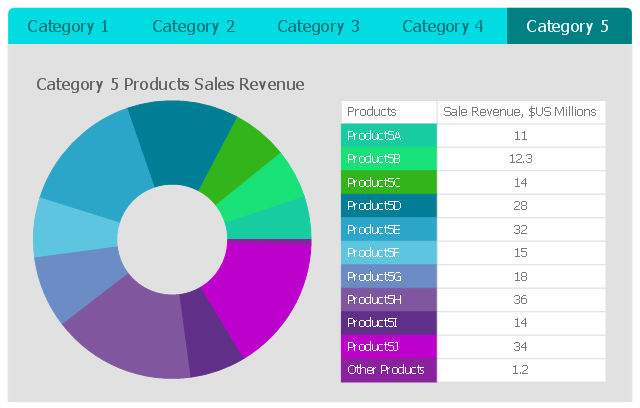
This business intelligence dashboard sample shows the quarter sales revenue for top 10 products by categories using donut charts.
"A doughnut chart (also spelled donut) is a variant of the pie chart, with a blank center allowing for additional information about the data as a whole to be included." [Pie chart. Wikipedia]
The BI dashboard example "Quarter Sales Revenue for Top 10 Products by Categories" was created using ConceptDraw PRO software extended with the Business Intelligence Dashboards solution from the Business Processes area of ConceptDraw Solution Park.
Category 1
Category 2
Category 3
Category 4
Category 5
 Pie Charts
Pie Charts are extensively used in statistics and business for explaining data and work results, in mass media for comparison (i.e. to visualize the percentage for the parts of one total), and in many other fields. The Pie Charts solution for ConceptDraw DIAGRAM offers powerful drawing tools, varied templates, samples, and a library of vector stencils for simple construction and design of Pie Charts, Donut Chart, and Pie Graph Worksheets.
 Business Intelligence Dashboard
Business Intelligence Dashboard solution extends the ConceptDraw DIAGRAM functionality with exclusive tools, numerous ready-to-use vector objects, samples and quick-start templates for creation professional Business Intelligence Dashboards, Business Intelligence Graphics, Business Intelligence Charts and Maps of different kinds. Design easy the BI dashboard, BI model or Dynamic chart in ConceptDraw DIAGRAM to monitor the company's work, to track the indicators corresponding your company's data, to display and analyze key performance indicators, to evaluate the trends and regularities of the processes occurring at the company.
Business Report Pie. Pie Chart Examples

 Basic Pie Charts
This solution extends the capabilities of ConceptDraw DIAGRAM (or later) with templates, samples, and a library of vector stencils for drawing pie and donut charts.
 Composition Dashboard
Composition dashboard solution extends ConceptDraw DIAGRAM software with templates, samples and vector stencils library with charts and indicators for drawing visual dashboards showing data composition.
 Food Court
Use the Food Court solution to create food art. Pictures of food can be designed using libraries of food images, fruit art and pictures of vegetables.
 ConceptDraw Solution Park
ConceptDraw Solution Park collects graphic extensions, examples and learning materials
Pyramid Chart Examples

Business Calendar

 Basic Circular Arrows Diagrams
This solution extends ConceptDraw DIAGRAM (or later) with samples, templates, and a library of vector stencils for drawing circular arrow diagrams.
- How to Draw a Line Chart Quickly | Sales Dashboard | Pie Donut ...
- Sales Growth. Bar Graphs Example | Sales Dashboard | Line Graph ...
- Sales Growth. Bar Graphs Example | Pie Donut Chart. Pie Chart ...
- Sales revenue - Dashboard | Sales Dashboard | Sales Process ...
- Sales Dashboards for Your Company | Sales Growth. Bar Graphs ...
- Sales Comparison Using Donut Chart
- Example Of Doughnut Pie Chart Professional
- Dashboard Pie Chart Compare
- Sales Growth. Bar Graphs Example | Chart Maker for Presentations ...
- Example Of Business Report With Graph
- Pie Chart Examples and Templates | Donut Chart Templates ...
- Blank Scatter Plot | Donut Chart Templates | How to Use ...
- Pie Charts | ConceptDraw Solution Park | Sales Growth. Bar Graphs ...
- Example Of A Business Pie Chart
- Sales Growth. Bar Graphs Example | Sales Process Flowchart ...
- Example Of A Graph Of Low Sales
- Sales Dashboard Solutions can help your sales team keep an eye ...
- Sample Pictorial Chart. Sample Infographics | Pie Donut Chart. Pie ...
- Pie Chart Examples and Templates | Donut Chart Templates ...
- Free Business Plan Donuts For Example