Dashboard
ConceptDraw PRO extended with Sales Dashboard solution from the Marketing area of ConceptDraw Solution Park is a perfect software for creating the live dashboard for the business data and progress visualization.HelpDesk
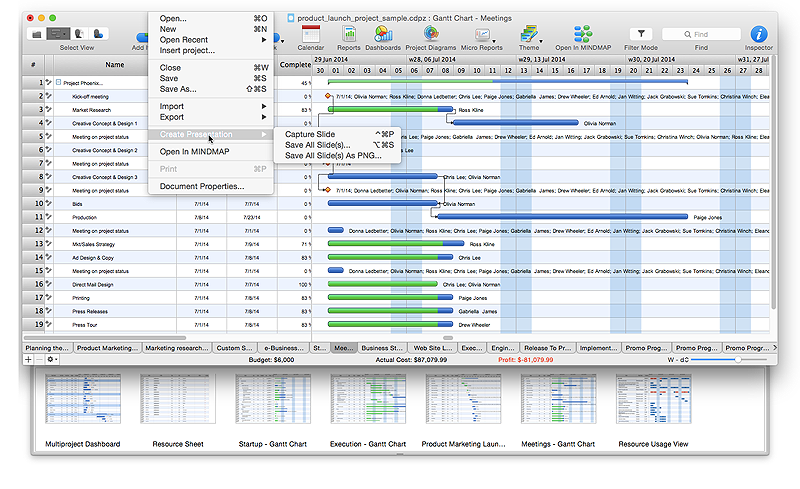
How to Get Images for Project Presentation on Macintosh
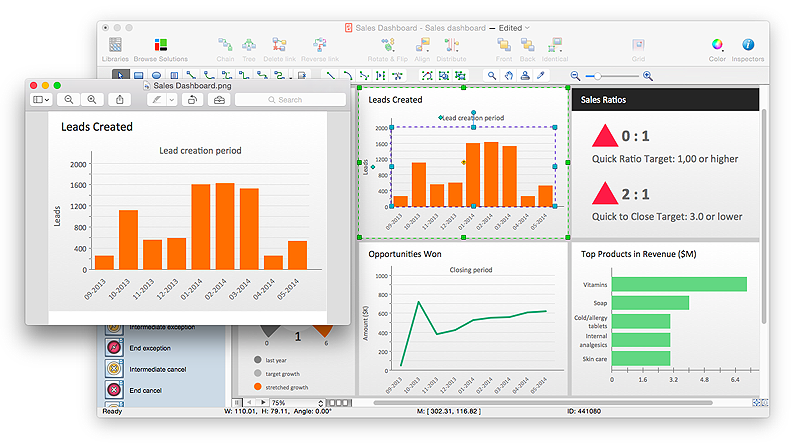
ConceptDraw PROJECT allows you to easily make slides for presentation.Export from ConceptDraw PRO Document to a Graphic File
Now it’s easy to share your visual documents with other people in a form most convenient for them. ConceptDraw PRO can save your drawings and diagrams in a number of highly useful formats, including graphic files. You can save your drawing as a .PNG, .JPG, or other graphic format file.
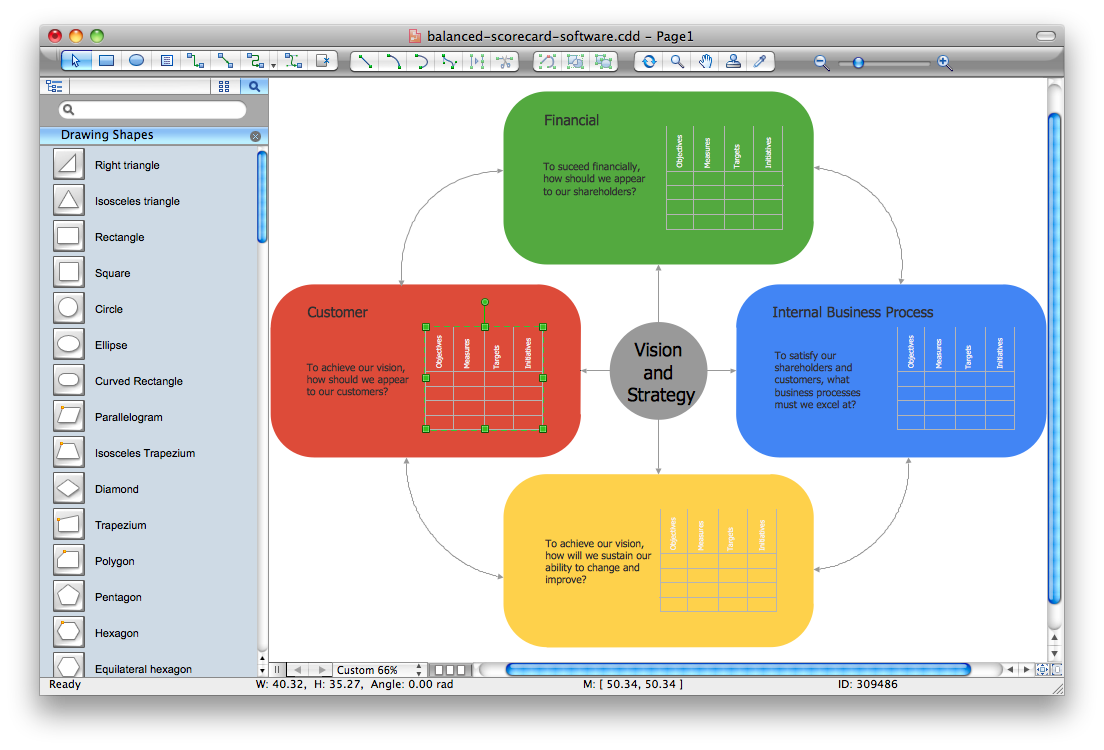
Balanced Scorecard Software
Balanced Scorecard Software provide incredible large variety of samples, templates and libraries of predesigned vector objects. Nothing could be easy that use the predesigned template and fill it, and simply drag the ready-to-use objects for designing your own balanced scorecard diagram.HelpDesk
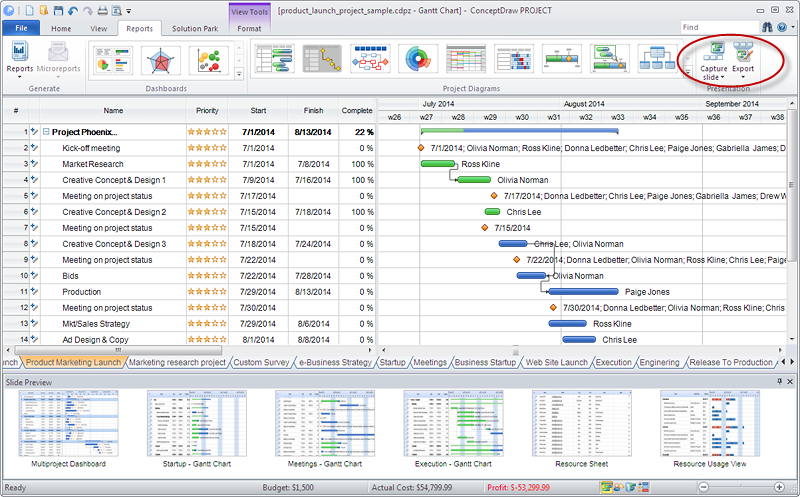
How to Get Images for Project Presentation on Windows
ConceptDraw PROJECT allows you to easily make slides for presentation.
 Picture Graphs
Typically, a Picture Graph has very broad usage. They many times used successfully in marketing, management, and manufacturing. The Picture Graphs Solution extends the capabilities of ConceptDraw PRO v10 with templates, samples, and a library of professionally developed vector stencils for designing Picture Graphs.
 Sales Dashboard
Sales Dashboard solution extends ConceptDraw PRO software with templates, samples and library of vector stencils for drawing the visual dashboards of sale metrics and key performance indicators (KPI).
How to Create Presentation of Your Project Gantt Chart
During the planning, discussing and execution of a project you may need to prepare a presentation using project views such as the Gantt Chart, Multiproject Dashboard or Resource Usage View. It’s easy do with ConceptDraw PROJECT!Business Report Pie. Pie Chart Examples
This sample shows the Business Report Pie Chart. The Pie Chart visualizes the data as the proportional parts of a whole, illustrates the numerical proportion. Pie Charts are very useful in the business, statistics, analytics, mass media.
 Entity-Relationship Diagram (ERD)
Entity-Relationship Diagram (ERD) solution extends ConceptDraw PRO software with templates, samples and libraries of vector stencils from drawing the ER-diagrams by Chen's and crow’s foot notations.
Competitor Analysis
Competitor analysis is a first and obligatory step in elaboration the proper corporate marketing strategy and creating sustainable competitive advantage. Use powerful opportunities of numerous solutions from ConceptDraw Solution Park for designing illustrative diagrams, charts, matrices which are necessary for effective competitor analysis.
 Sales Dashboard
Sales Dashboard solution extends ConceptDraw PRO software with templates, samples and library of vector stencils for drawing the visual dashboards of sale metrics and key performance indicators (KPI).
Best Tool for Infographic Construction
ConceptDraw is a best data visualization tool that will allow everyone to create rich infographics and visualizations quickly and easily.
 Entity-Relationship Diagram (ERD)
An Entity-Relationship Diagram (ERD) is a visual presentation of entities and relationships. That type of diagrams is often used in the semi-structured or unstructured data in databases and information systems. At first glance ERD is similar to a flowch
HelpDesk
How to Save a Drawing as a Graphic File in ConceptDraw PRO
ConceptDraw PRO can save your drawings and diagrams in a number of highly useful formats, including graphic files. You can save your drawing as a .PNG, .JPG, or other graphic format file.- Dashboard Indicator Images
- PM Dashboards | Project — Working With Tasks | Business Diagram ...
- Dashboard | How to Connect Text Data to a Time Series Chart on ...
- Winter Sports | Meter Dashboard | Basketball Court Dimensions ...
- KPI Dashboard | Basic Flowchart Symbols and Meaning | Human ...
- Football Field Image Meters
- Meter Dashboard | Cloud clipart - Vector stencils library | Georgia ...
- PM Dashboards | Business Diagram Software | Project — Working ...
- Rainfall Bar Chart | Bar Graph | Picture Graphs | Bar Graph Image ...
- Line Graph Images
- Energy Meter Dashboard
- Picture graph - Template | Manufacturing in America | Manufacturing ...
- Gantt Chart Image
- Healthy Diet Plan | Healthy Diet | Food Pictures | Image Of Balance ...
- Line Graph | Line Chart Examples | Pictures of Graphs | Line Graph ...
- Basic Diagramming | Pictures of Graphs | Regional population ...
- KPI Dashboard | Exporting project data from ConceptDraw Project ...
- Image Of Back Arrow
- Holiday | Processing Flow Chart | Picture Graphs | Draw New Year ...
- Android User Interface | PM Dashboards | Android GUI | Android ...


