KPI Dashboard
ConceptDraw DIAGRAM diagramming and vector drawing software supplied with Sales Dashboard solution from the Marketing area of ConceptDraw Solution Park provides the full set of useful tools which make it the best for producing the live KPI Dashboard of any complexity.Business Graphics Software
ConceptDraw DIAGRAM is a business graphics software that allows you improve your business using Sales Performance Dashboard helps you analyze your data more efficiently.
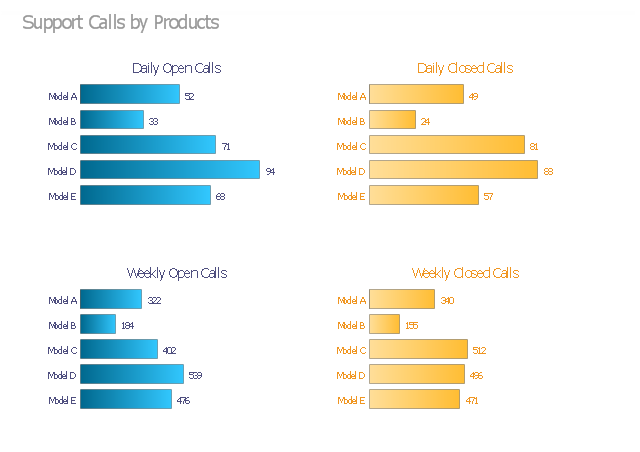
The visual dashboard example "Support calls by products" contains 4 horizontal bar charts used for the comparison of support calls data by products.
"Dashboards often provide at-a-glance views of KPIs (key performance indicators) relevant to a particular objective or business process (e.g. sales, marketing, human resources, or production). ... Dashboards give signs about a business letting the user know something is wrong or something is right. The corporate world has tried for years to come up with a solution that would tell them if their business needed maintenance or if the temperature of their business was running above normal. Dashboards typically are limited to show summaries, key trends, comparisons, and exceptions." [Dashboard (business). Wikipedia]
The business dashboard example "Support calls by products" was created using the ConceptDraw PRO diagramming and vector drawing software extended with the Comparison Dashboard solution from the area "What is a Dashboard" of ConceptDraw Solution Park.
Comparing ConceptDraw DIAGRAM to Omnigraffle
Comparing ConceptDraw DIAGRAM to Omnigraffle - Cross-platform product. While most drawing tools are designed for use on one operating system, ConceptDraw DIAGRAM is available as two independent and concurrent versions on both Macintosh (macOS) and PC (Windows).License is per named user. That means you can use a single license for Macintosh and PC. Users can install at work and at home with a single license.
Business Diagram Software
ConceptDraw business diagram Software is the most powerful business and relational charting software. Create advanced, completely customizable flow charts, organizational charts, business process diagrams, work flow diagrams, audit diagram, value stream maps, TQM diagrams, ERD diagrams, EPC diagrams, marketing diagrams, cause and effect diagrams, dashboards, infographics and other relational business diagrams from your data.HelpDesk
How to Create a Bubble Diagram
Bubble Diagram is a simple chart that consists of circles (bubbles) repesening certain topics or processes. Bubbles are connected by lines depicting the type of relationships between the bubbles. The size of each bubble is depended on the importance of the entity it represents. Bubble charts are widely used throughout social, economical, medical, and other scientific researches as well as throughout architecture and business management. Bubble charts are often used during the early stages of product development to visualize thoughts and ideas for the purpose of sketching out a development plan. ConceptDraw DIAGRAM allows you to draw a bubble diagrams using the Bubble Diagrams solution.Project —Task Trees and Dependencies
Users new to ConceptDraw PROJECT will find the Basic lessons an essential platform for familiarizing themselves with the program′s functions. This video lesson will teach you how to set up task trees and dependencies.What Constitutes a Project?
Separated into categories of Basic, Intermediate, and Advanced categories, the new instructional videos about ConceptDraw PROJECT cover a huge breadth of topics. Users new to ConceptDraw PROJECT will find the Basic lessons an essential platform for familiarizing themselves with the programs′s functions. This video lesson is the first in Basic lessons series.Project — Working With Costs
ConceptDraw PROJECT delivers a rich set of built-in functionalities and optional product extensions that support your daily workflow in time-saving and creative ways. This video lesson will teach you how to work with costs in your project document.How To Plan and Implement Projects Faster
ConceptDraw Office is the most effective tool for planning, tracking, and reporting all types of projects with strong management capabilities, user friendly functionality, and superior ease of use. In this tutorial video we will assist you in planning and managing a project using ConceptDraw Office.CORRECTIVE ACTIONS PLANNING. Risk Diagram (PDPC)
Risk Diagram (PDPC) - ConceptDraw OFFICE suite is a software for Risks Diagram making. This diagram identifies possible risks in accomplishing corrective actions. With the Risks Diagram, one analyzes each action separately in a tree of all actions and develops a preventive action in response of each potential obstacles or circumstances which may be a risk.ConceptDraw DIAGRAM
ConceptDraw DIAGRAM is a powerful business and technical diagramming software tool that enables you to design professional-looking graphics, diagrams, flowcharts, floor plans and much more in just minutes. Maintain business processes performance with clear visual documentation. Effectively present and communicate information in a clear and concise manner with ConceptDraw DIAGRAM.ConceptDraw PROJECT Software Overview
ConceptDraw PROJECT is an effective tool for new and experienced users with a fine balance of usability and powerful functionality.- Kpi Dashboard Examples
- Business Productivity Area | Project Management Area | Kpi ...
- Performance Indicators | Enterprise dashboard | KPI Dashboard ...
- What is a KPI ? | KPI Dashboard | Sales Dashboard Template | Ppt ...
- Performance Indicators | What is a KPI ? | KPI Dashboard | Key ...
- Sales Organization | The Facts and KPIs | Performance Indicators ...
- Status Dashboard | PM Dashboards | Meter Dashboard | Free ...
- Sales Growth. Bar Graphs Example | Picture Graphs | Lean ...
- Reporting Dashboard Software for Business | Sales Teams are ...
- Status Dashboard | Project task status dashboard - Template | PM ...
- Performance Indicators | KPI Dashboard | What is a KPI ? | Key ...
- Website KPIs - Visual dashboard | A KPI Dashboard Provides the ...
- Status Dashboard | Project Management Dashboards Solution ...
- Sales Dashboard - Access Anywhere | Dashboard | KPI Dashboard ...
- PM Dashboards | How to Create Project Dashboard on Mac | Project ...
- Visualize Sales Data Using Sample Data | A KPI Dashboard | Ways ...
- Project Dashboard Excel
- Sales Organization | The Facts and KPIs | How to Create a Sales ...
- PM Dashboards | What Information can be Displayed in the ...
- Meter Dashboard | BPR Diagram. Business Process Reengineering ...
- ERD | Entity Relationship Diagrams, ERD Software for Mac and Win
- Flowchart | Basic Flowchart Symbols and Meaning
- Flowchart | Flowchart Design - Symbols, Shapes, Stencils and Icons
- Flowchart | Flow Chart Symbols
- Electrical | Electrical Drawing - Wiring and Circuits Schematics
- Flowchart | Common Flowchart Symbols