Dashboard Software
ConceptDraw PRo is a software that is perfect for creating dynamic dashboards for visualizing sales data. You can match your KPI to pre-designed visual indicators and start tracking your sales performance in real-time.Reporting Dashboard Software for Business
An effective way to improve your business is using reporting dashboard software. ConceptDraw PRO software extended with the Sales Dashboard solution helps you monitor all KPI on the one screen in real time.Sales Dashboard - Access Anywhere
ConceptDraw Sales Dashboard is an automatically updated sales dashboard you can customize to see KPI you need. You can access sales dashboard anywhere to get fresh data and use any minute to see how your business can improve.KPI Dashboard
ConceptDraw PRO diagramming and vector drawing software supplied with Sales Dashboard solution from the Marketing area of ConceptDraw Solution Park provides the full set of useful tools which make it the best for producing the live KPI Dashboard of any complexity.Sales Dashboard
Sales Dashboard is a useful and visual way of representing sales performances, tracking and analyzing sales. It gives a clear picture about the business development success and sales growth progress.ConceptDraw PRO software extended with Sales Dashboard solution from the Marketing area of ConceptDraw Solution Park is effective for visualizing sales data, all set of KPIs on the Sales Dashboard with purpose to see how your business develops and to make conclusions for improvement the sales.
Sales Analytics
With Sales Dashboard solution for ConceptDraw PRO sales analytics become as simple and visual as never before. Visualizing sales data using ConceptDraw Sales Dashboard allows you keep all KPI on the one page and see how your business can improve.Performance Indicators
ConceptDraw PRO diagramming and vector drawing software offers the useful tools of the Sales Dashboard solution from the Marketing area for easy creating professional looking live dashboards which allow to track the business sales activity and progress thanks to representing the Key Performance Indicators (KPIs) on them.Dashboard
ConceptDraw PRO extended with Sales Dashboard solution from the Marketing area of ConceptDraw Solution Park is a perfect software for creating the live dashboard for the business data and progress visualization.How To Create Project Report
ConceptDraw PROJECT contains an extensive tool set to help project managers. The rich data visualization capability that is provided by ConceptDraw products helps you create project dashboards, one-click reports, multi-project views, Gantt charts, and resource views. Let′s learn how to get maximum value using ConceptDraw PROJECT!
 Mac OS X User Interface
Mac OS User Interface solution extends ConceptDraw PRO gui software with templates, samples and Mac OS user interface design examples, and large quantity of libraries with variety of vector stencils for designing the OS X 10.10 Yosemite user interfaces.
What is a KPI?
What is a KPI? Key performance indicators (KPIs) represent a set of measures that are focused on the aspects of organizational performance which are the most important for its current and future success.ConceptDraw PRO diagramming and vector drawing software enhanced with Sales Dashboard solution from the Marketing area of ConceptDraw Solution Park allows effectively develop, analyze and improve your business thanks to the excellent possibility of monitoring all KPIs on one screen in a real time.
Business Intelligence Dashboard Software
ConceptDraw PRO is a business intelligence dashboard software that allows you produce sales dashboard that suites your specific needs. To see how your business can improve with sales dashboards select KPI and start tracking it.HelpDesk
How to Create Project Dashboard on Mac
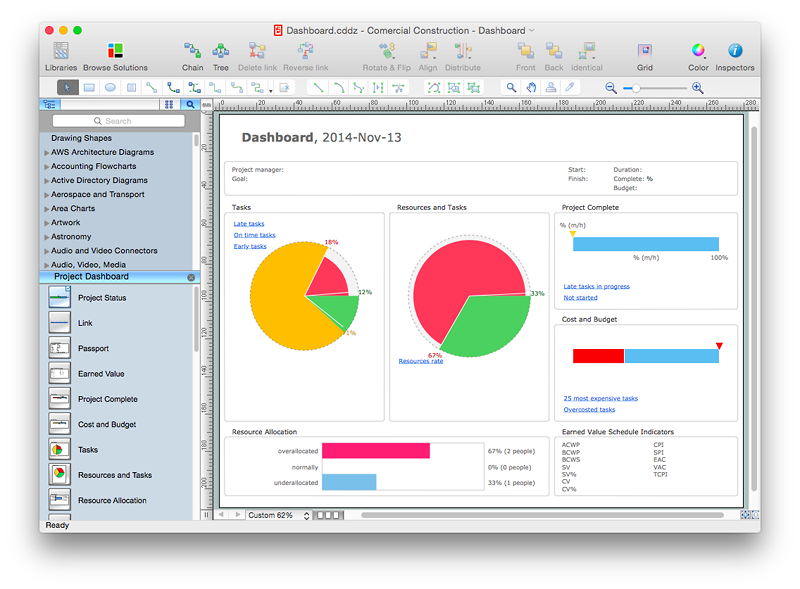
The visual Project Dashboard within ConceptDraw Office is the best way to deliver a clear view of project performance to all project participants.
 ConceptDraw Dashboard for Facebook
ConceptDraw Dashboard for Facebook solution extends ConceptDraw PRO software with a dynamically updated visual dashboard, which shows lifetime total likes, daily friends of fans, and daily page views, information you can receive from Facebook Insights.
 What is a Dashboard Area
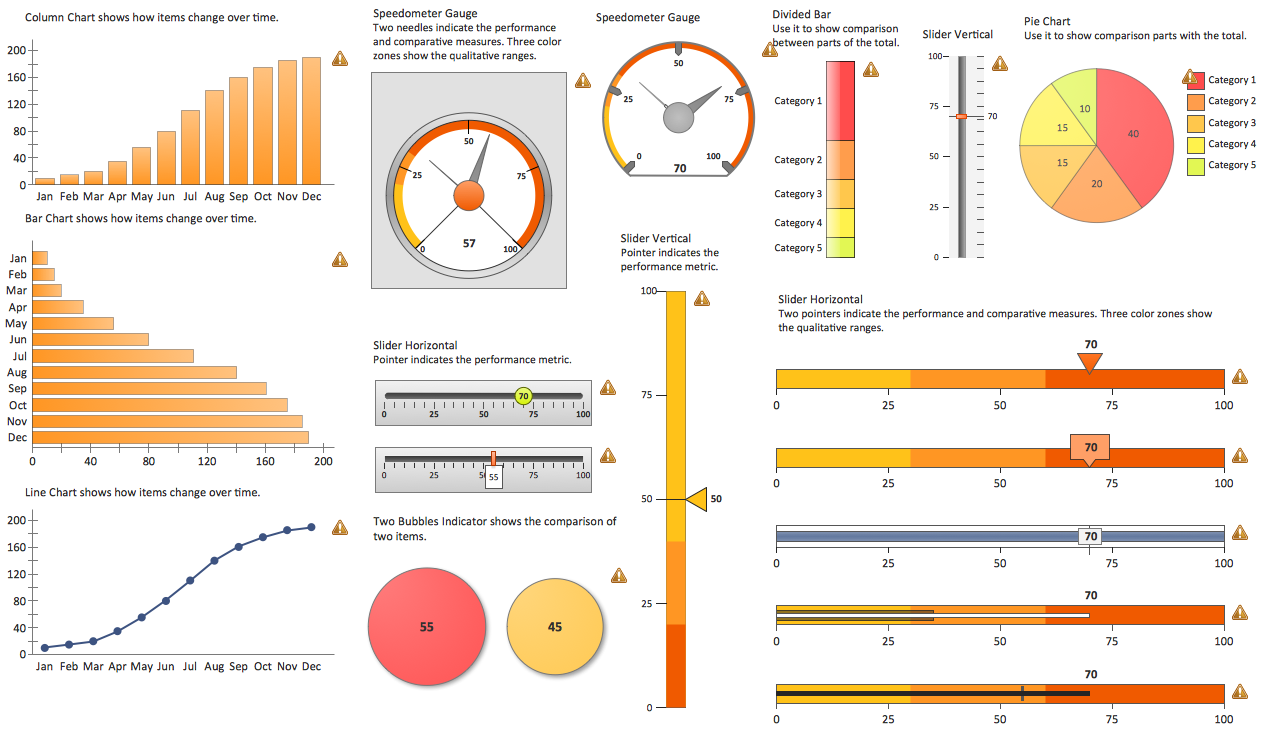
Solutions from the area What is a Dashboard of ConceptDraw Solution Park collects templates, samples and vector stencils libraries with of data driven charts and indicators for drawing the basic types of Visual Dashboards.
- Reporting Dashboard Software for Business | Dashboard Software ...
- How to Create Project Dashboard on Mac | Pie Charts | How to ...
- How to Create Project Dashboard on Mac | How to Manage Multiple ...
- Sales Dashboard - Access Anywhere | Sales Dashboard ...
- Software Sales Dashboard
- Support calls by products - Business dashboard | Reporting ...
- PM Dashboards | KPI Dashboard | How to Create Project ...
- KPI Dashboard | Sales Dashboard - Access Anywhere | Reporting ...
- Reporting Dashboard Software for Business | Sales Teams are ...
- Software Project Dashboard
- Sales Dashboard - Access Anywhere | Business Intelligence ...
- Projects HR dashboard | Simple Drawing Applications for Mac ...
- Reporting Dashboard Software for Business | PM Dashboards ...
- Sales Dashboard - Access Anywhere | Sales Dashboard Template ...
- Sales Dashboard | Sales revenue - Dashboard | Sales KPIs ...
- Business Graphics Software | Meter Dashboard | Sales Dashboards ...
- Dashboard Management Software
- PM Dashboards | How to Create Project Dashboard on Mac | Status ...
- Column Chart Software | Bar Chart Software | What is a Dashboard ...


