HelpDesk
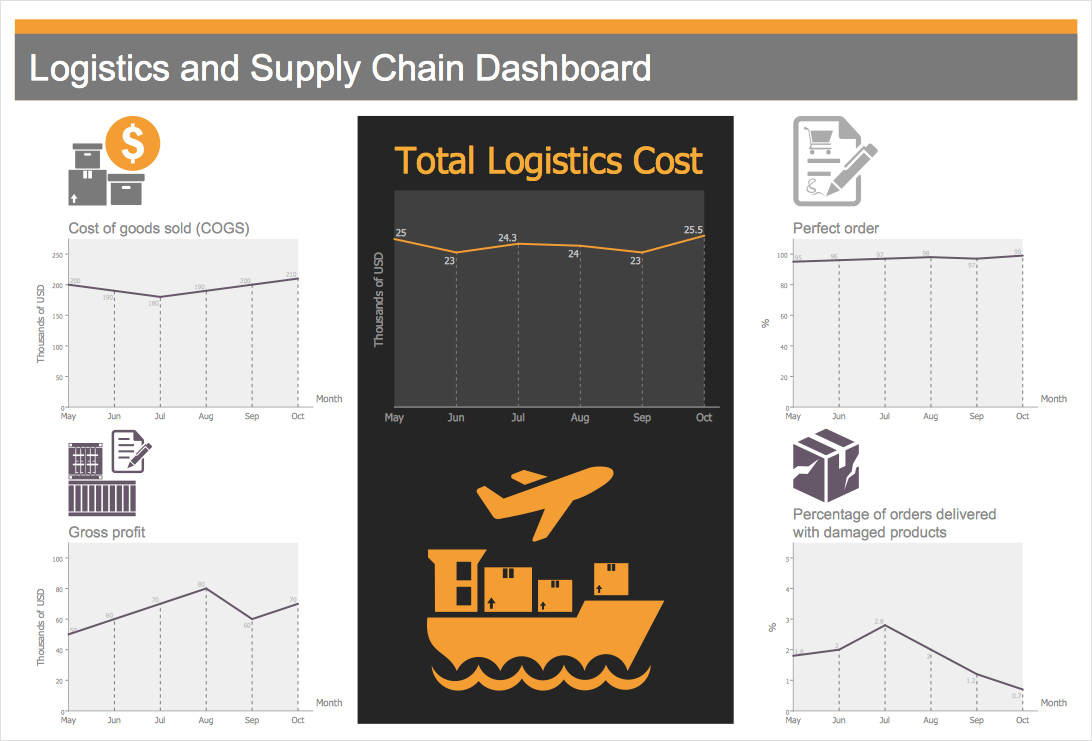
How to Make a Logistic Dashboard
Logistics and supply chain data represented in the view of the dashboard can show the real picture of the logistic management activity of the organization. It can display important logistics KPIs like Supply chain performance measures, warehouse statistics, and more logistics KPIs. The dashboard provides managers, marketers, and analysts to improve the management of financial, informational, internal and external material flows and processes. The logistics dashboard ensures the precise accounting of document and goods turnover, logistics infrastructure and logistic costs. It helps to improve the management of financial, informational, internal and external material flows and processes. Logistics Dashboard Solution for ConceptDraw DIAGRAM allows you to see what information you need from each logistics KPI to see if your logistic process performs fast, accurate and cost-efficient.HelpDesk
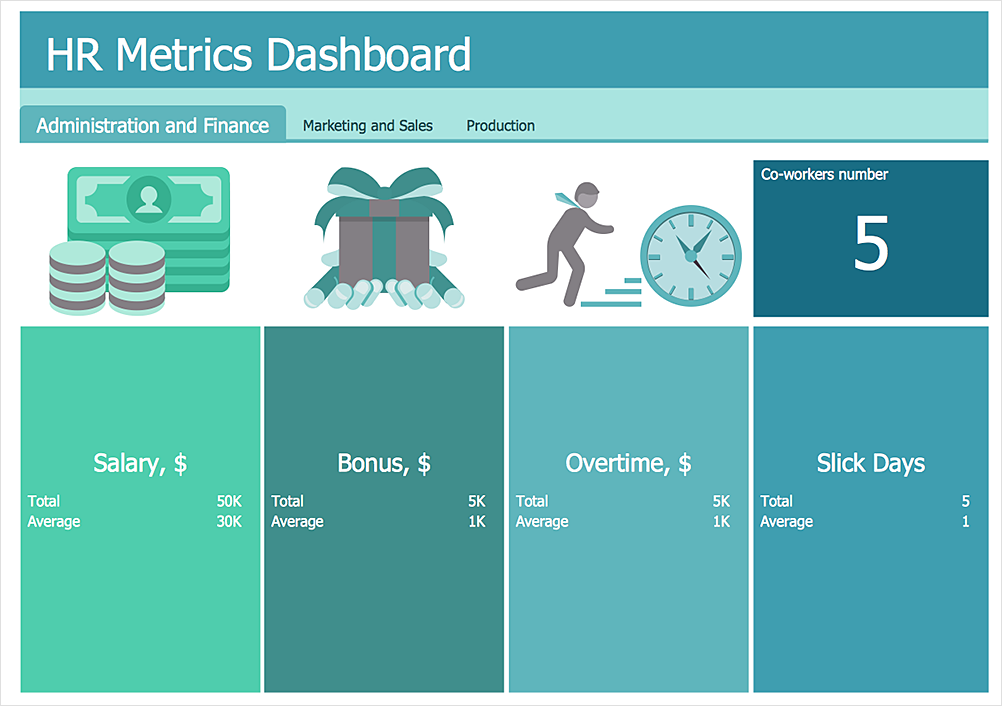
How To Create an HR Metric Dashboard
Human Resources dashboards can be used for analyzing hr workflow in an organization and identifying points for improvement. They are useful to HR managers, and for C level executives. HR dashboard helps to monitor HR KPIs. Thus Decision makers will ensure that company strategy is aligned from an executive, to managerial, to individual goals. HR Dashboard Solution for ConceptDraw DIAGRAM allows you to see what information you need from each KPI to see if your Human Resources management performs accurate and cost-efficient.HelpDesk
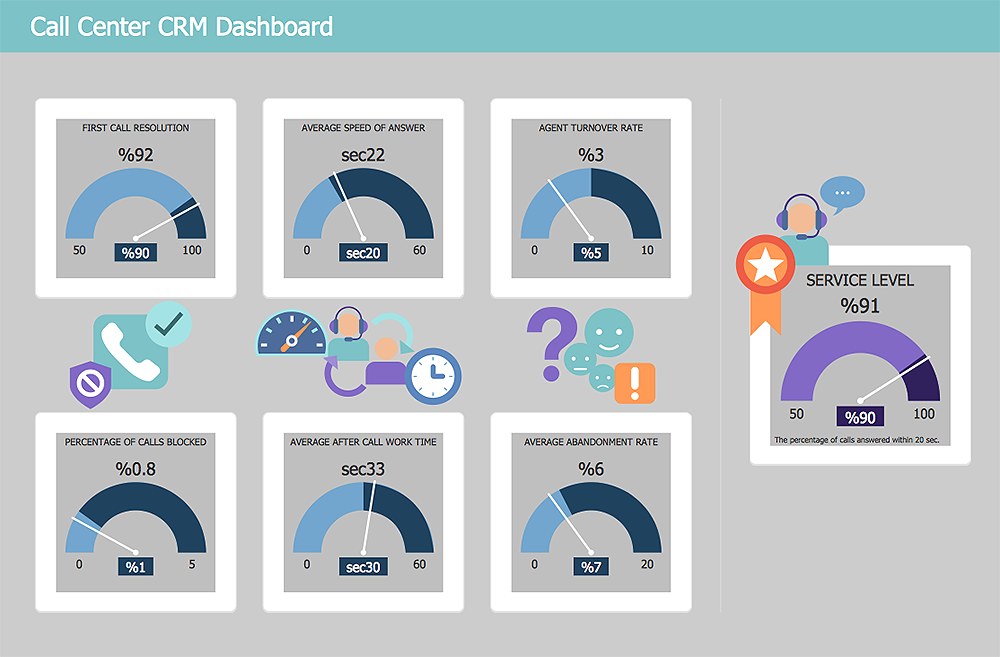
How To Create a CRM System Dashboard
Succeed in drawing the CRM Dashboards and CRM Center Dashboards depicting current and actual companies information and data with ConceptDraw DIAGRAM CRM software supplied with CRM Center Dashboard solution.HelpDesk
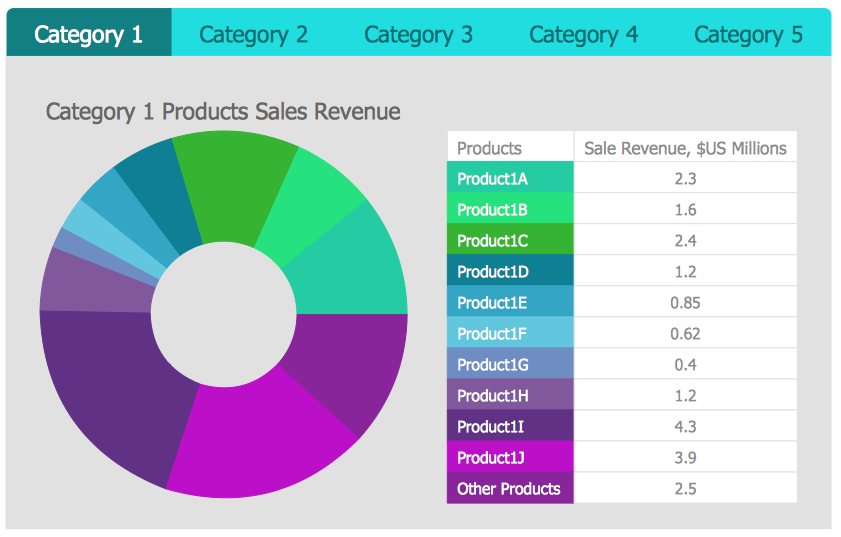
How to Make Business Intelligence Dashboard
The business data represented in the view of dashboard can show the real picture of the activity of the entire organization, or it can display particular information like website effectiveness, call center statistics, and more business KPIs in the company. Dashboards provides managers, marketers, and analysts to quickly sort out the position of the company and to determine the weakest links. The dashboard helps to to compare easily different stages of business process and to accomplish the right decision. Business Intelligence Solution for ConceptDraw DIAGRAM makes for a powerful analytical tool that displays an organization’s processes and provides valuable competitive insight into business performance.HelpDesk
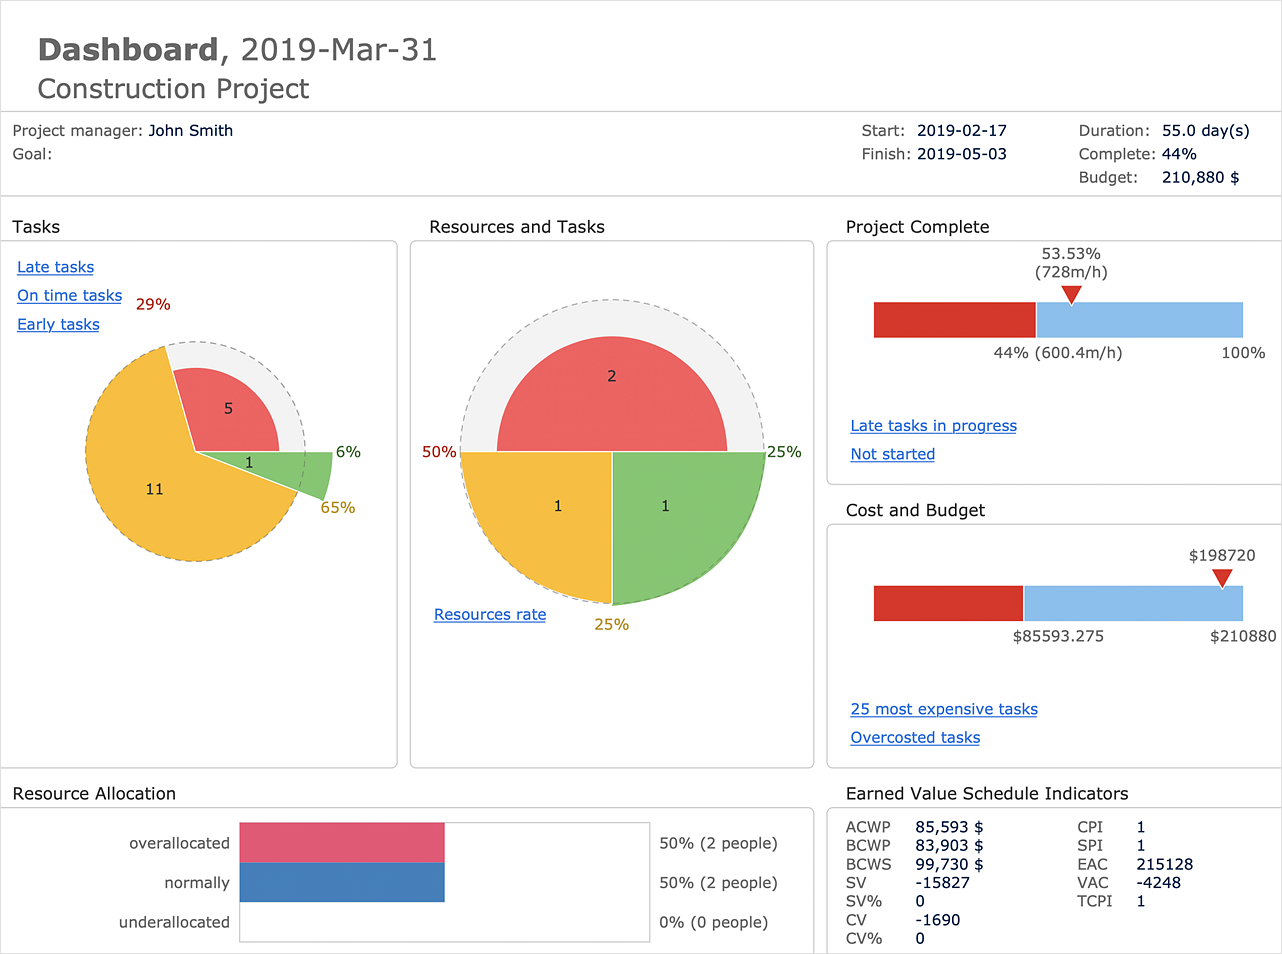
How to Track Your Project Plan vs. the Actual Project Condition
ConceptDraw PROJECT provides a user with the possibility to track how the project is going. Project Manager can compare the actual data with the planned and assess possible measures to resolve issues. ConceptDraw PROJECT has several types of visual reports that can help to assess visually the difference between planned and actual project data.
 eLearning for Skype
This solution extends ConceptDraw MINDMAP software with the ability to prepare and run remote learning sessions by using Skype
 Basic Pie Charts
This solution extends the capabilities of ConceptDraw DIAGRAM (or later) with templates, samples, and a library of vector stencils for drawing pie and donut charts.
- Flowchart Software | ConceptDraw Dashboard for Facebook ...
- ConceptDraw Dashboard for Facebook | Vsm Template Xls
- ConceptDraw Dashboard for Facebook | Sales Dashboard Xls
- ConceptDraw Dashboard for Facebook | Value Stream Mapping ...
- Flowchart Software | ConceptDraw Dashboard for Facebook ...
- How to Use ConceptDraw Dashboard for Facebook on PC | How to ...
- Download Kpi Transportation Logistics Dashboard Xls
- Quality Function Deployment Example Xls
- Process Flow Diagram Example Xls
- Mindmap Gantt Chart Template Xls
