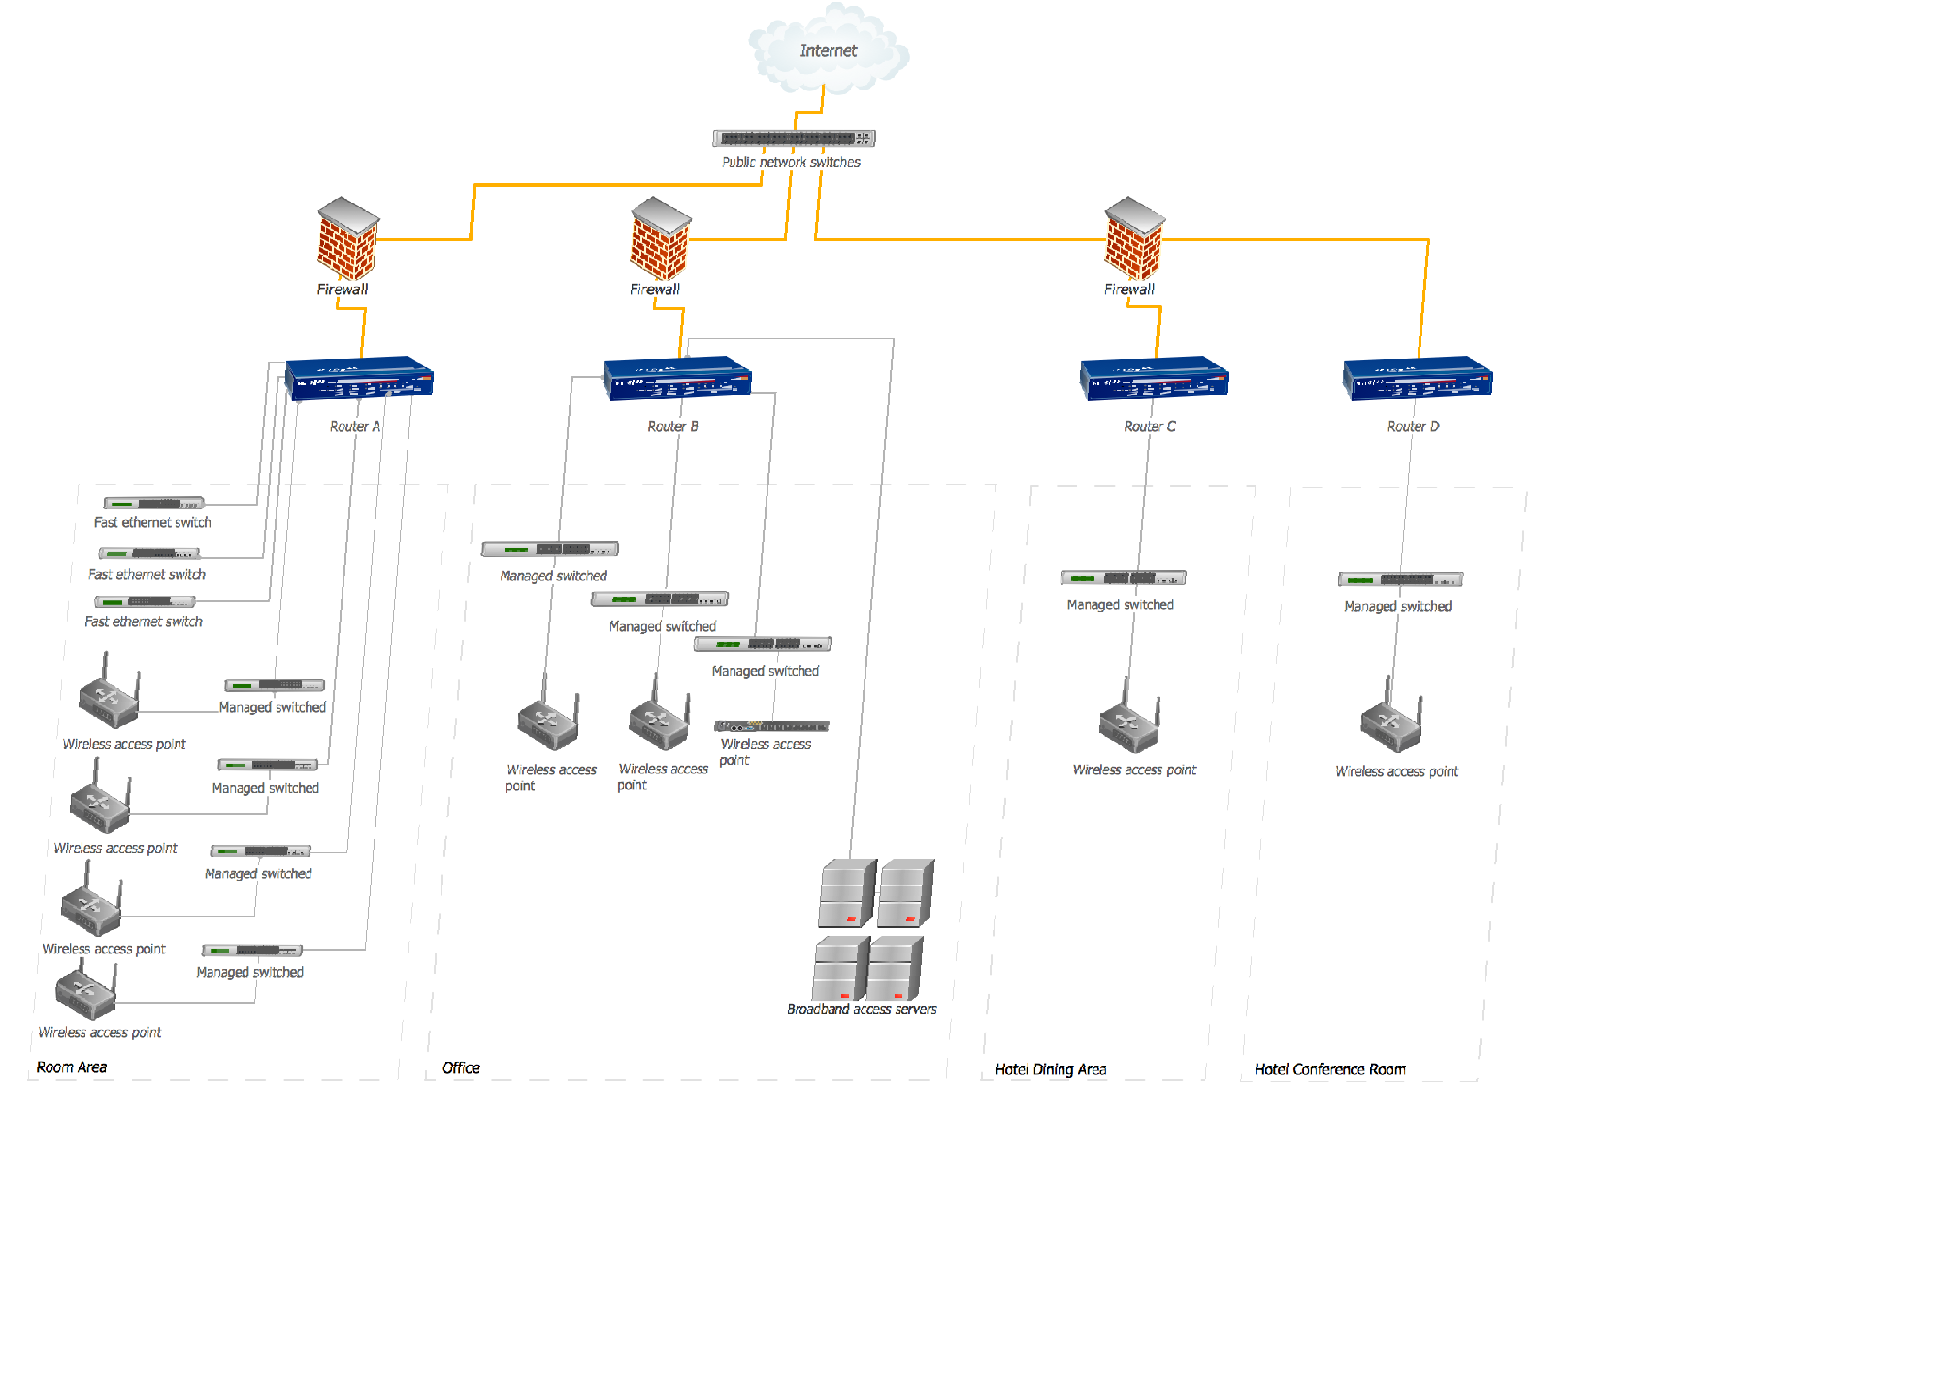
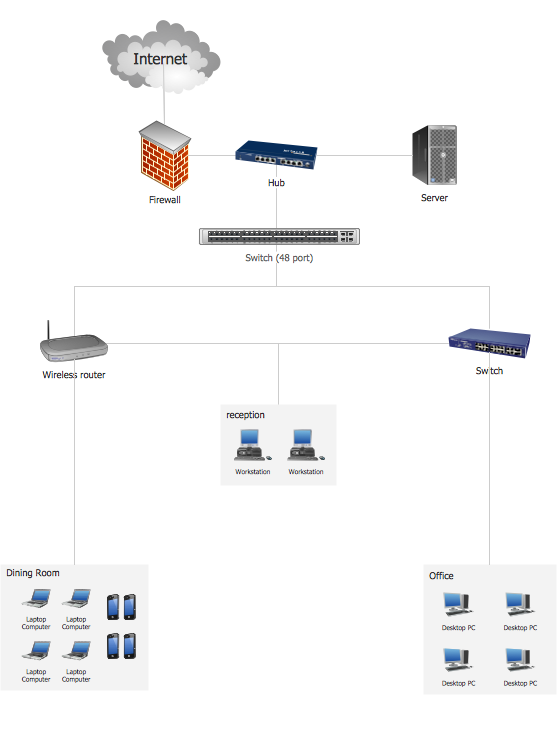
Hotel Network Topology Diagram


Hotel Network Topology Diagram. Hotel Guesthouse WiFi Network
This example was redesigned from the Wikipedia file: LastResortHotel BookRoom Process.png. [en.wikipedia.org/ wiki/ File:LastResortHotel_ BookRoom_ Process.png]
This file is licensed under the Creative Commons Attribution-ShareAlike 3.0 License. [creativecommons.org/ licenses/ by-sa/ 3.0/ ]
"Event partitioning is an easy-to-apply systems analysis technique that helps the analyst organize requirements for large systems into a collection of smaller, simpler, minimally-connected, easier-to-understand ‘mini systems’ / use cases. ...
Defining requirements.
Single process in a fictitious hotel using data flow diagram notation.
Single use case in a fictitious hotel using use case diagram notation.
This approach helps the analyst to decompose the system into ‘mentally bite-sized’ mini-systems using events that require a planned response. The level of detail of each response is at the level of ‘primary use cases’. Each planned response may be modelled using DFD notation or as a single use case using use case diagram notation.
The basic flow within a process or use case can usually be described in a relatively small number of steps, often fewer than twenty or thirty, possibly using something like ‘structured English’. Ideally, all of the steps would be visible all at once (often a page or less). The intention is to reduce one of the risks associated with short-term memory, namely, forgetting what is not immediately visible (‘out of sight, out of mind’). ...
Single process in a fictitious hotel using data flow diagram notation." [Event partitioning. Wikipedia]
The DFD example "Last resort hotel book room process" was created using the ConceptDraw PRO diagramming and vector drawing software extended with the Data Flow Diagrams solution from the Software Development area of ConceptDraw Solution Park.
DFD

Data Flow Diagram Software

Hotel Service Process
Example of DFD for Online Store (Data Flow Diagram)


Data Flow Diagram

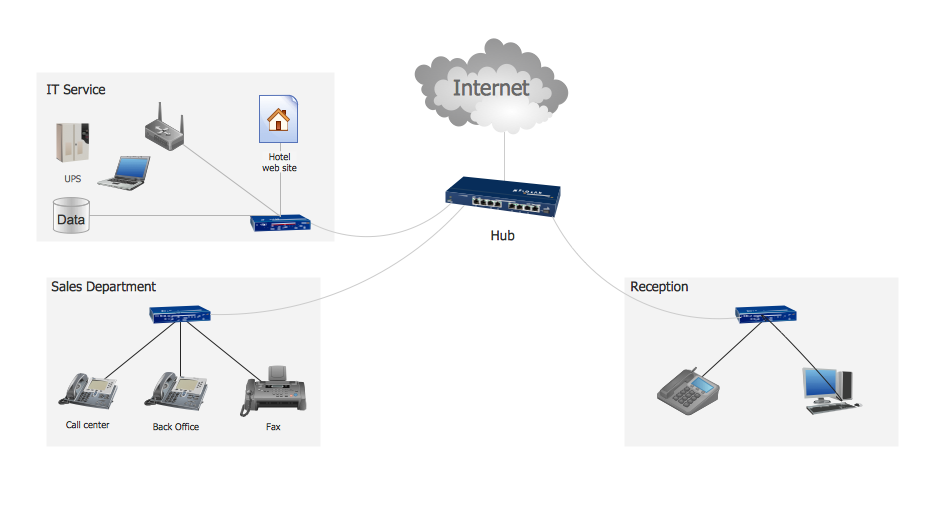
Network Diagram Software Physical Network Diagram

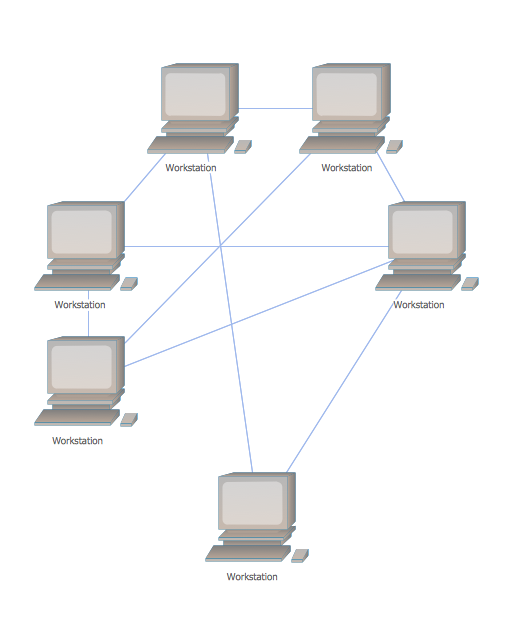
Mesh Network Topology Diagram
Fishbone Diagram Design Element
.png)
Hotel Network Topology
Entity Relationship Diagram - ERD - Software for Design Crows Foot ER Diagrams
_Win_Mac.png)

Interactive Voice Response Network Diagram

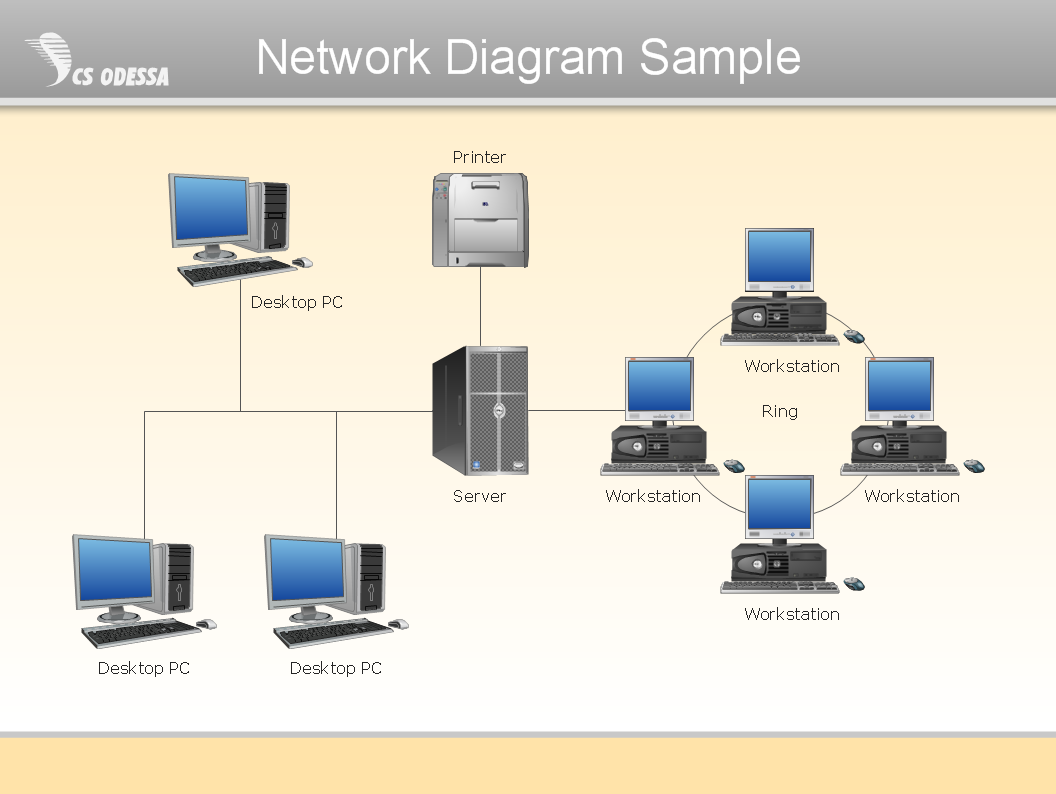
Draw Network Diagram based on Templates and Examples

Local area network (LAN). Computer and Network Examples
 diagram")
- Hotel Management System Project Data Flow Diagram
- UML Class Diagram Example - Apartment Plan | Data Flow Diagram ...
- Process Flow Diagram Hotel
- Data Flow Diagram Of Hotel Reservation System Level 0
- Hotel reservation system | Sales Flowcharts | Data Flow Diagram ...
- Process Flowchart | Hotel Plan. Hotel Plan Examples | Data Flow ...
- Onion Diagram Templates | Hotel Network Topology Diagram | Data ...
- Example of DFD for Online Store ( Data Flow Diagram ) DFD ...
- Example of DFD for Online Store ( Data Flow Diagram ) DFD ...
- Last resort hotel book room process - DFD | Data Flow Diagram ...
- Activity Diagram For Hotel Management System Pdf
- Data Flow Diagram Software | Hotel Plan. Hotel Plan Examples ...
- Single Line Diagram Of Hotel
- Example of DFD for Online Store ( Data Flow Diagram ) DFD ...
- Data Flow Diagram On Hotel Booking System
- Hotel Service Process | Example of DFD for Online Store ( Data Flow ...
- Hotel Network Topology Diagram | Hotel Plan. Hotel Plan Examples ...
- UML Block Diagram | Hotel Network Topology Diagram | UML Class ...
- Data Flow Diagram | Design Element: Rack Diagram for Network ...
- Data Flow Diagram For Room Reservation