HelpDesk
How to Make PowerPoint Presentation of Data Driven Infographics
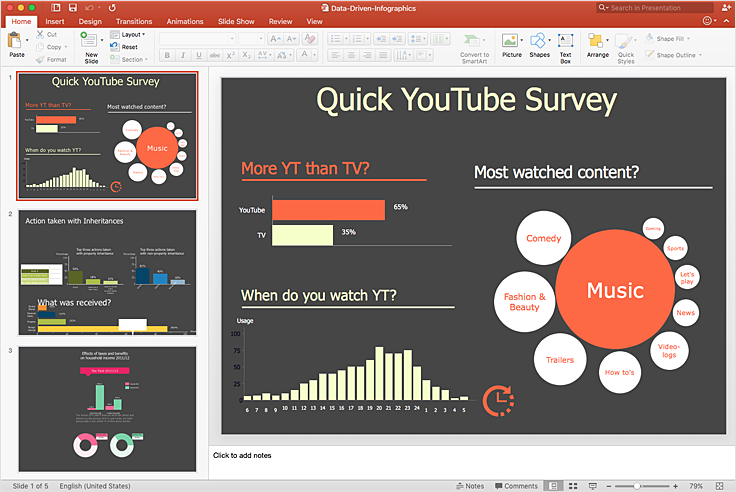
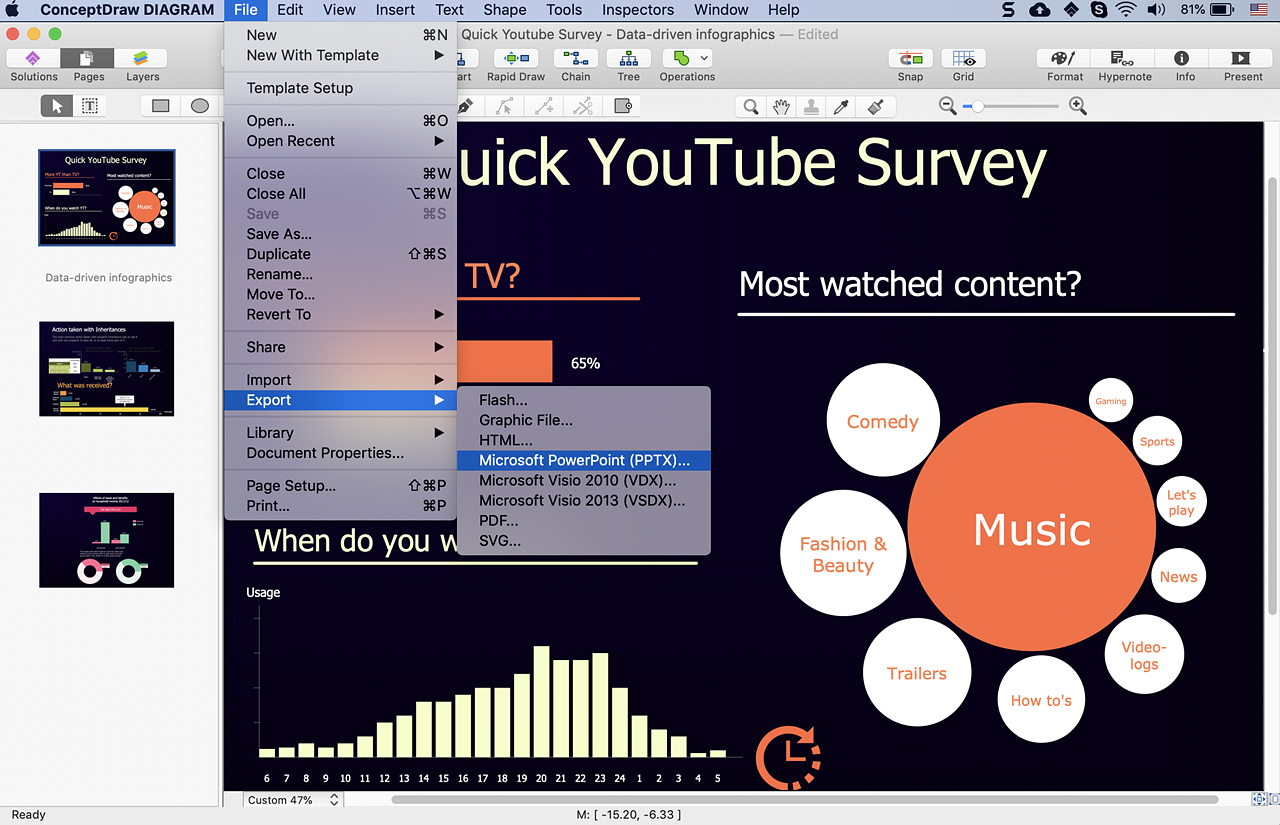
ConceptDraw DIAGRAM can be used as a tool for creating data-driven infographics. It allows you to draw data driven using the special templates and vector stencils libraries. ConceptDraw DIAGRAM allows you to make a MS PowerPoint Presentation from your Data-driven infographics in a few simple steps.HelpDesk
How to Create Data-Driven Infographics
Data-driven infographics are used in wildly disparate areas of business and commerce. To make effective Data-driven infographics, it's useful to have a wide variety of graphical elements — icons, clipart, stencils, charts, and graphs — to illustrate your diagram. ConceptDraw Data-driven Infographics solution provides all the tools you need to present data as described by this article — as well as the charts mentioned previously, you can find histograms, divided bar charts, ring charts, line graphs, and area charts — meaning you can find the perfect medium for displaying a certain type of data. It allows you to draw data-driven infographics quickly and easily using the special templates and vector stencils libraries. It can be used to quickly communicate a message, to simplify the presentation of large amounts of data, to see data patterns and relationships, and to monitor changes in variables over time.HelpDesk
How to Perform a Presentation on Windows Using Two Monitors
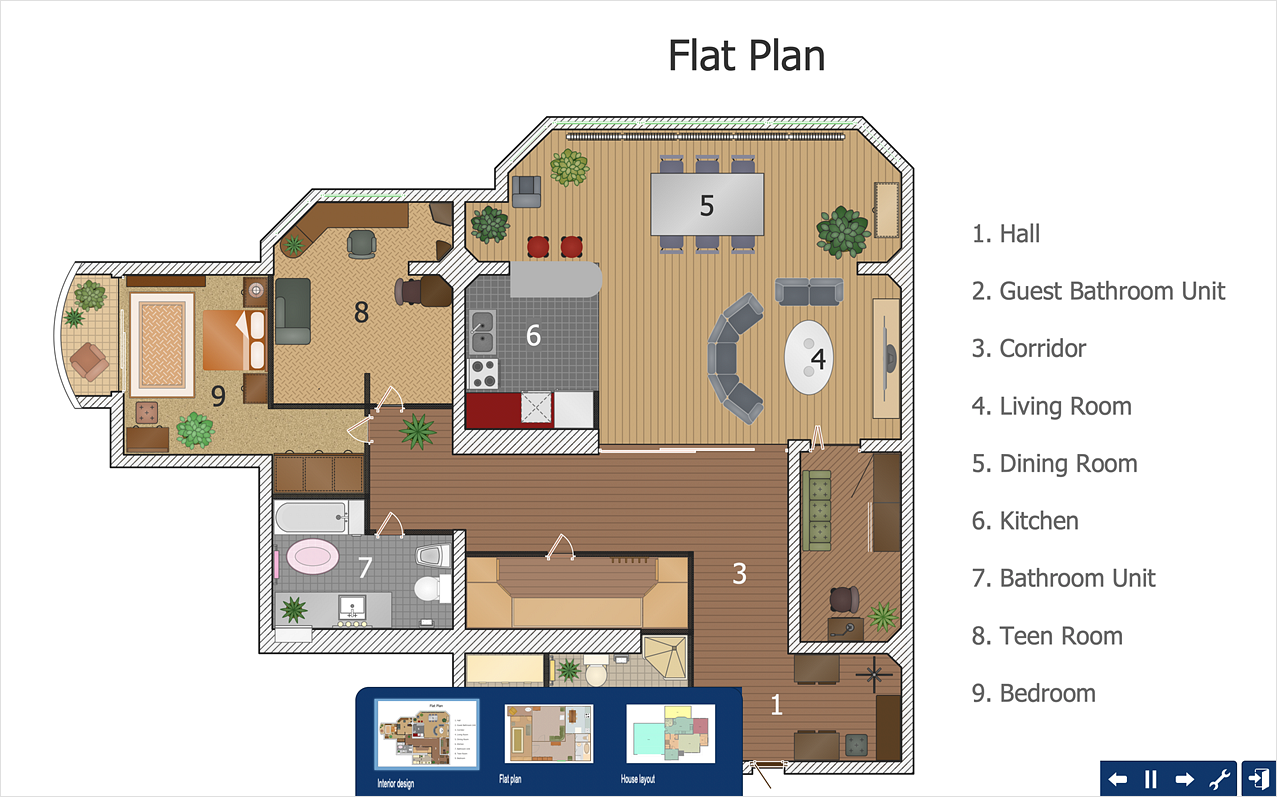
ConceptDraw DIAGRAM's Presentation Mode supports multiple monitors. So, you can run a presentation using one monitor and use the same or a different document open for editing on the other monitor.
 PM Presentations
The PM Presentations solution extends the power of ConceptDraw MINDMAP , ConceptDraw DIAGRAM , and ConceptDraw PROJECT, improving their efficiency at many stages of the project management process by using the same source data to construct the targeted presentation for your audience and clearly communicating the appropriate information to different audiences from a single source. It gives an ability to project managers and other team participants to create and to deliver capacious presentations representing the data and knowledge of a specific project with the help of including visual dashboards, Gantt charts, resource views, maps, timelines, calendars, illustrations, project diagrams and reports of varied types. Having the possibility to edit collaboratively in a Full-Screen Mode, the teams can rapidly plan a project as well as execute the tasks of revising and making changes to it.
 Presentation Clipart
Presentation design elements solution extends ConceptDraw DIAGRAM software with slide samples, templates and vector stencils libraries with design elements of presentation symbols, arrows, callouts, backgrounds, borders and frames, title blocks.
HelpDesk
How to Add Data-driven Infographics to MS Word Document
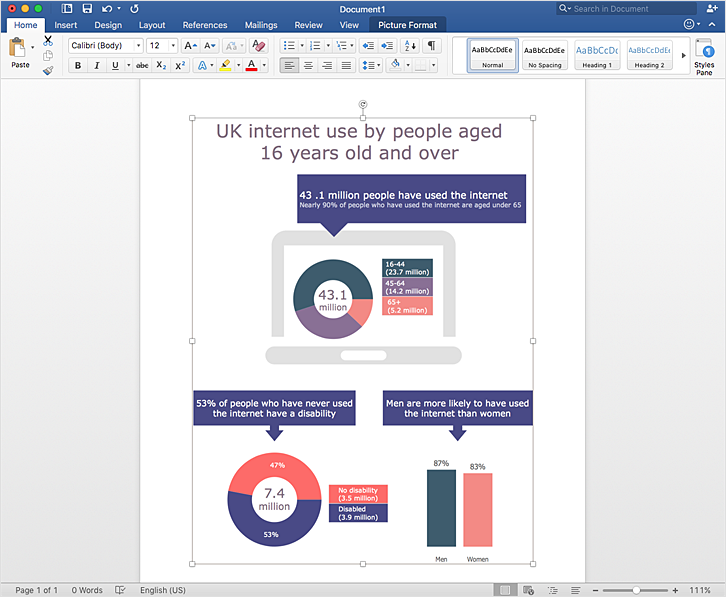
Infographics are usually used as an effective way of showing a certain portion of information. There are a wide of range of subjects that can be represented in such a way. One of the most simple usages for the infographics, in business diagrams. Sales staff can use it as an effective method of sharing the sales results with the entire team and stakeholders. ConceptDraw Data-driven Infographics solution gives all the tools one need to present a certain type of data. ConceptDraw DIAGRAM allows you to easily create data-driven infographics and then insert them into an MS Word document.
 Presentation Exchange
This solution extends ConceptDraw MINDMAP software with the ability to import presentations from Microsoft PowerPoint, as well as enhancing its existing presentation capabilities.
HelpDesk
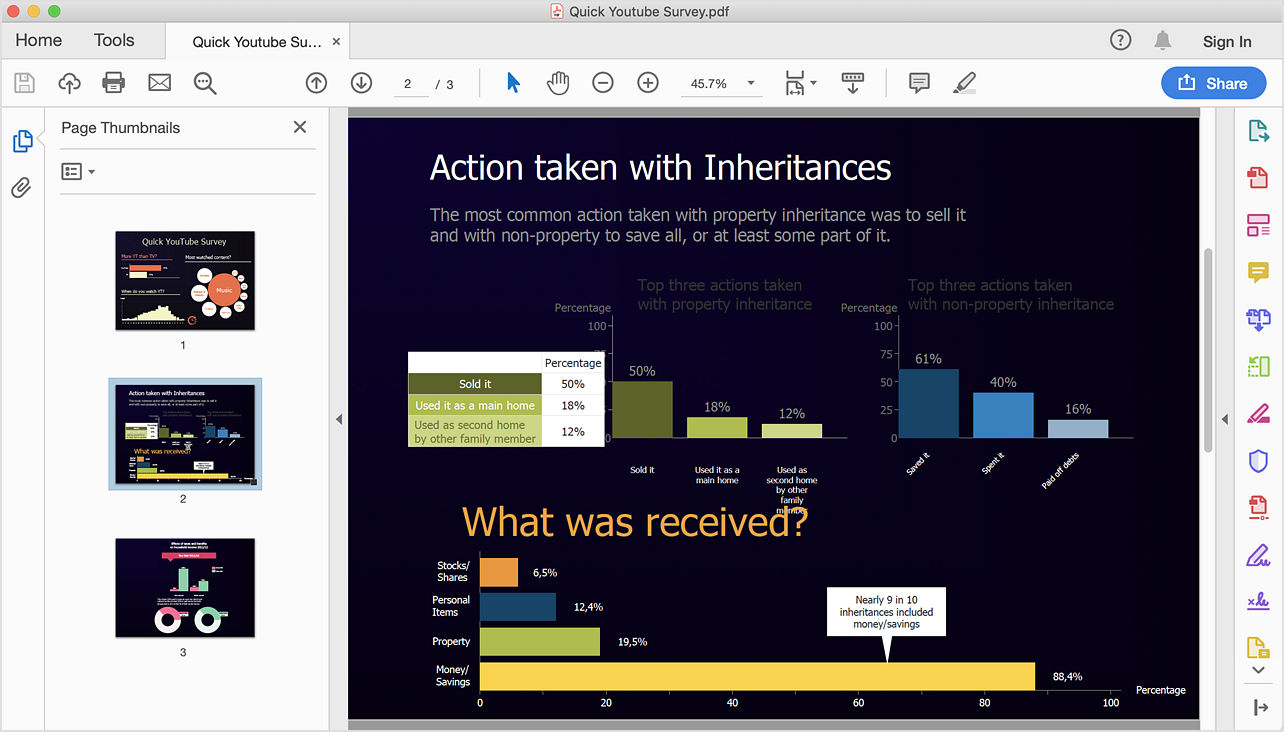
How To Convert Data-Driven Infographics to Adobe PDF
ConceptDraw DIAGRAM allows you to easily share your business diagrams between different computers with different operating systems and applications using its export capabilities. You can get clear infographics in pdf format and avoid any problems while communicating them with stakeholders.HelpDesk
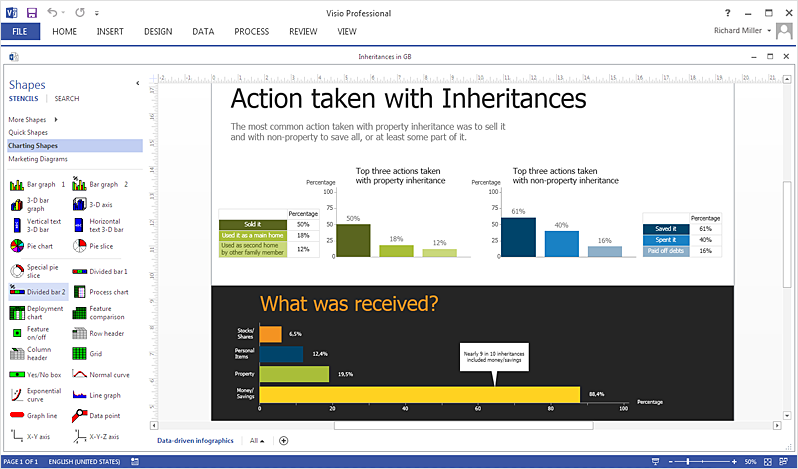
How To Create an MS Visio Data-Driven Infographics
ConceptDraw DIAGRAM allows you to easily create data-driven infographics of any complexity and then make an MS Visio file from your diagram in a few simple steps.- How to Create PowerPoint Presentation from Data Driven ...
- How to Create Presentation of Your Project Gantt Chart | PM ...
- How to Create Data - driven Infographics | How to Add Data - driven ...
- Data - driven charts - Vector stencils library | Pie Chart Software ...
- Infographic Tools | Design Elements - Data - driven charts | Data ...
- How to Add a Bubble Diagram to a PowerPoint Presentation Using ...
- How To Convert Data - driven Infographics to Adobe PDF | How to ...
- Data - driven charts - Vector stencils library | Design Elements - Data ...
- Make Ppt Presentation Graphics
- Bar Graph Powerpoint Presentation
