 Data Flow Diagrams (DFD)
Data Flow Diagrams solution extends ConceptDraw DIAGRAM software with templates, samples and libraries of vector stencils for drawing the data flow diagrams (DFD).
In searching of alternative to MS Visio for MAC and PC with ConceptDraw DIAGRAM
Undoubtedly MS Visio is a powerful and multifunctional tool, but however at times occur the instances, when it turns unable of meeting certain users' requirements. At this cases you may need to use an alternative program software, preferably it will be simple, convenient, and at the same time powerful and professional. In searching the alternative to MS Visio for MAC and PC we recommend you to pay attention for ConceptDraw DIAGRAM software, which was developed to satisfy all your drawing needs and requirements. It is a fully-functioned alternative product to MS Visio for both platforms. ConceptDraw DIAGRAM software has many advantages, the main among them are the cross-platform compatibility, a reasonable price, widespread ConceptDraw Solution Park with huge variety of different solutions that offer numerous libraries of specialized vector objects, useful examples, samples, and quick-start templates, extensive import / export capabilities, built-in script language, MS Visio support and certainly free technical support.HelpDesk
How to Add a Bubble Diagram to MS Word
A bubble chart is a diagram in which the data points are replaced with bubbles, and the size of the bubbles represents some additional dimension of the data. A bubble chart does not have the axis. A bubble chart can be used instead of a scatter diagram if the data has three dimensions, each of that containing the set of values. The sizes of the bubbles are determined by the values in the third dimension. Any additional information about the entities beyond their three primary dimensions can be depicted by rendering bubbles in colors and patterns that are selected in a certain way. The legend containing the further information can be added to a bubble diagram. ConceptDraw DIAGRAM allows you to easily create various business management and marketing charts, including bubble diagrams and then add them to a MS Word document.Business diagrams & Org Charts with ConceptDraw DIAGRAM
The business diagrams are in great demand, they describe the business processes, business tasks and activities which are executed to achieve specific organizational and business goals, increase productivity, reduce costs and errors. They let research and better understand the business processes. ConceptDraw DIAGRAM is a powerful professional cross-platform business graphics and business flowcharting tool which contains hundreds of built-in collections of task-specific vector stencils and templates. They will help you to visualize and structure information, create various Business flowcharts, maps and diagrams with minimal efforts, and add them to your documents and presentations to make them successful. Among them are Data flow diagrams, Organization charts, Business process workflow diagrams, Audit flowcharts, Cause and Effect diagrams, IDEF business process diagrams, Cross-functional flowcharts, PERT charts, Timeline diagrams, Calendars, Marketing diagrams, Pyramids, Target diagrams, Venn diagrams, Comparison charts, Analysis charts, Dashboards, and many more. Being a cross-platform application, ConceptDraw DIAGRAM is very secure, handy, free of bloatware and one of the best alternatives to Visio for Mac users.
 Word Exchange
This solution extends ConceptDraw MINDMAP software with the ability to quickly create the framework for a future article or book, fill the structure with ideas, and use it to produce an MS Word document with just a simple click of the mouse.
HelpDesk
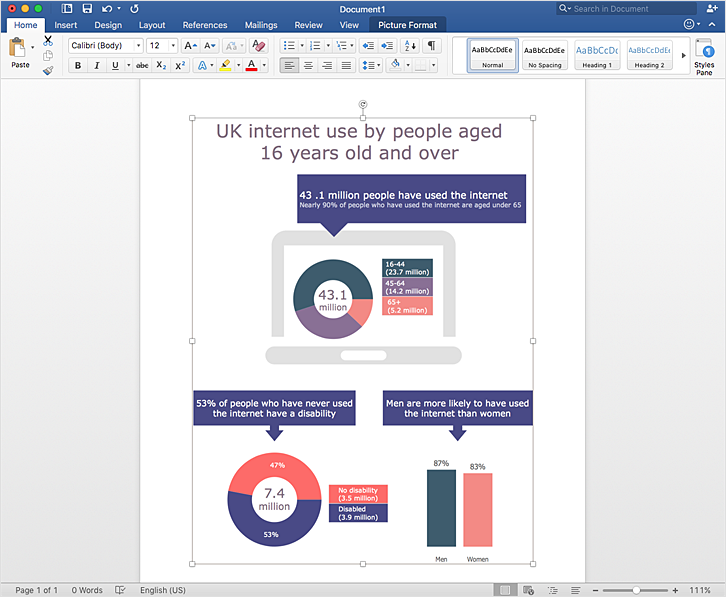
How to Add Data-driven Infographics to MS Word Document
Infographics are usually used as an effective way of showing a certain portion of information. There are a wide of range of subjects that can be represented in such a way. One of the most simple usages for the infographics, in business diagrams. Sales staff can use it as an effective method of sharing the sales results with the entire team and stakeholders. ConceptDraw Data-driven Infographics solution gives all the tools one need to present a certain type of data. ConceptDraw DIAGRAM allows you to easily create data-driven infographics and then insert them into an MS Word document.- Data Flow Diagrams (DFD)
- Word Exchange | Data Flow Diagrams (DFD) | Process Flowchart ...
- UML Collaboration Diagram (UML2.0) | Data Flow Diagrams (DFD ...
- How to Make SWOT Analysis in a Word Document | Data Flow ...
- Dfd Diagram Template In Word
- How to Make SWOT Analysis in a Word Document | Data Flow ...
- Dfd Templet Word File
- Presenting Documents with Skype | Data Flow Diagrams | Business ...
- Data Flow Diagrams (DFD) | Word Exchange | All Level Dfd For ...
- Data Flow Diagrams | Process Flowchart | How to Add a Business ...
- Flowchart Software | Process Flowchart | Word Exchange ...
- Data Flow Diagrams (DFD) | Last resort hotel book room process ...
- How to Add a Cross-Functional Flowchart to an MS Word Document ...
- Gane Sarson Diagram | DFD , Gane-Sarson notation - Template ...
- Data Flow Diagrams | Business diagrams & Org Charts with ...
- How to Add a Cross-Functional Flowchart to an MS Word Document ...
- Process Flowchart | How to Create a PowerPoint® Presentation from ...
- How to Add a Business Process Diagram to a MS Word Document ...
- Dfd Diagram Tools On Mac
- Process Flowchart | Basic Flowchart Symbols and Meaning | How to ...


