Example of DFD for Online Store (Data Flow Diagram)
Data Flow Diagram (DFD) is a methodology of graphical structural analysis and information systems design, which describes the sources external in respect to the system, recipients of data, logical functions, data flows and data stores that are accessed. DFDs allow to identify relationships between various system's components and are effectively used in business analysis and information systems analysis. They are useful for system’s high-level details modeling, to show how the input data are transformed to output results via the sequence of functional transformations. For description of DFD diagrams are uses two notations — Yourdon and Gane-Sarson, which differ in syntax. Online Store DFD example illustrates the Data Flow Diagram for online store, the interactions between Customers, Visitors, Sellers, depicts User databases and the flows of Website Information. ConceptDraw DIAGRAM enhanced with Data Flow Diagrams solution lets you to draw clear and simple example of DFD for Online Store using special libraries of predesigned DFD symbols.
 Flowcharts
The Flowcharts solution for ConceptDraw DIAGRAM is a comprehensive set of examples and samples in several varied color themes for professionals that need to represent graphically a process. Solution value is added by the basic flow chart template and shapes' libraries of flowchart notation. ConceptDraw DIAGRAM flow chart creator lets one depict the processes of any complexity and length, as well as design the Flowchart either vertically or horizontally.
 Circle-Spoke Diagrams
Examples of subject areas that are well suited to this approach are marketing, business, products promotion, process modeling, market, resource, time, and cost analysis. Circle-Spoke Diagrams are successfully used in presentations, conferences, management documents, magazines, reportages, reviews, reports, TV, and social media.
 Building Plans Area
The Building Plans Area collects solutions for drawing the building and site plans.
HelpDesk
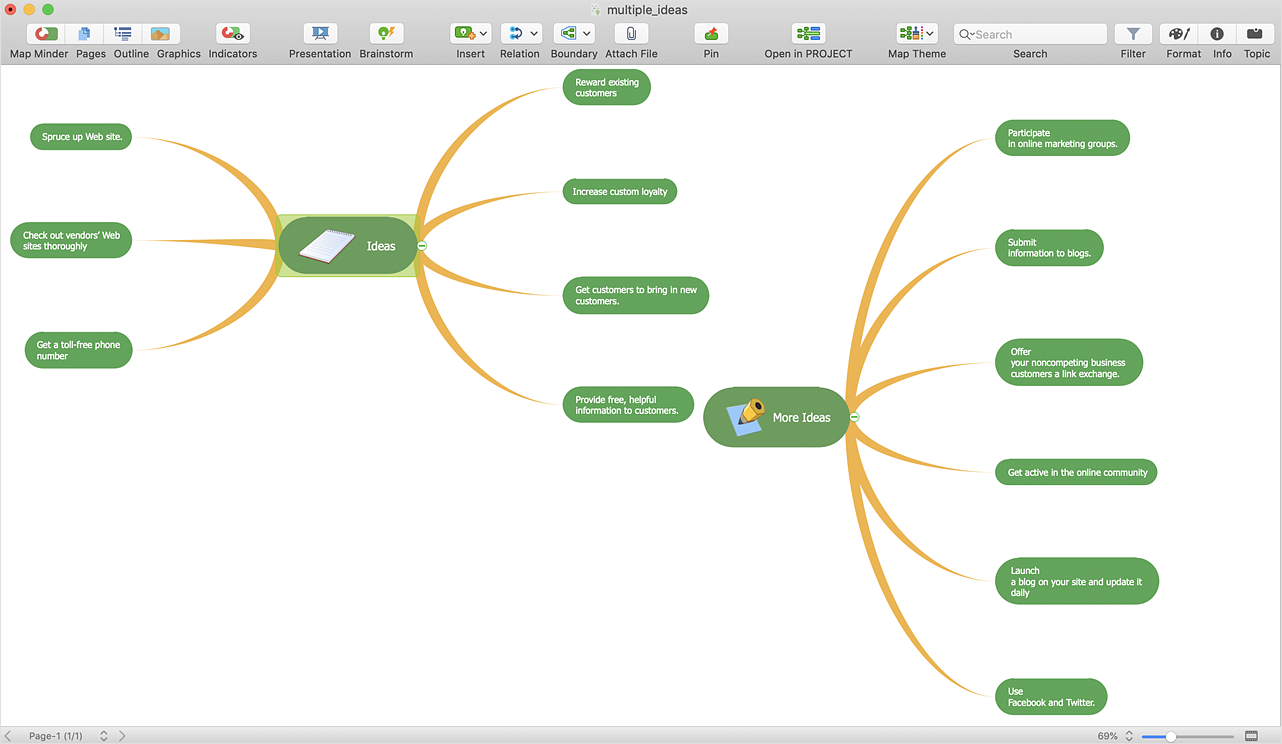
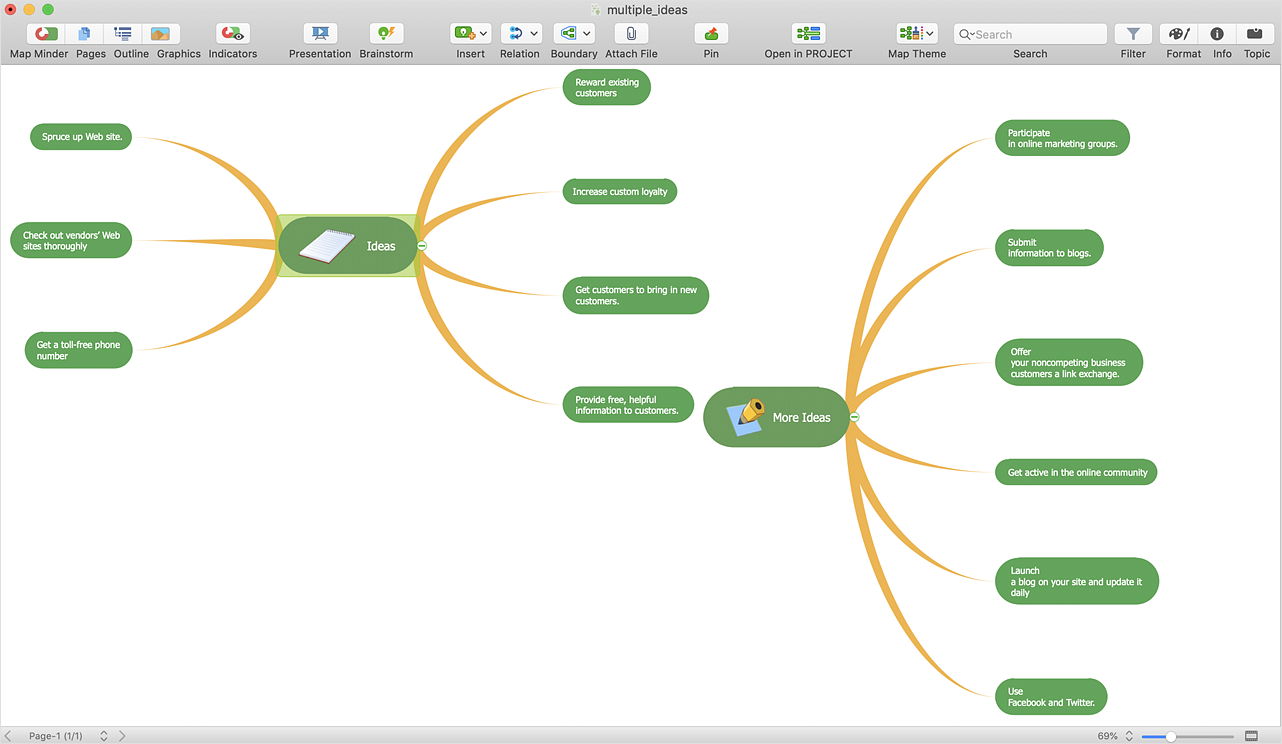
How to Create a Mind Map with Multiple Main Ideas
Classical mind map consists from the single Main Idea surrounded with related ideas and branches, deepening the main theme. The Multiple Main Idea on a single mind map page is a really useful when you have a lot of corresponding ideas. ConceptDraw MINDMAP allows you to insert a number of different mind maps onto a single workspace.HelpDesk
How to Operate a Multiple Main Idea on Your Mind Map
If you are using multiple Main Ideas your maps, it is necessary to know that there is a difference in behavior between the original primary Main Idea and the other Ideas you add.- Data Flow Diagram For Store Management System
- Data Flow Diagram Of Billing System
- Example of DFD for Online Store ( Data Flow Diagram ) DFD ...
- Example of DFD for Online Store ( Data Flow Diagram ) DFD ...
- Example of DFD for Online Store ( Data Flow Diagram ) DFD ...
- Flow chart Example. Warehouse Flowchart | UML Class Diagram ...
- HR professions - Vector stencils library | Florist Shop Diagram
- Example of DFD for Online Store ( Data Flow Diagram ) DFD ...
- Flow chart Example. Warehouse Flowchart | DFD Flowchart ...
- Tailor Icon Png
- Ivr Flow Chart Examples
- Store reporting flowchart | How to Create an Interactive Voice ...
- Funny transport - Vector stencils library | Example of DFD for Online ...
- Data Vector Art
- SDL Flowchart Symbols | Store reporting flowchart | How to Create a ...
- Travel And Management System Flowchart
- Ture And Travel System Flow Chart
- Flow chart Example. Warehouse Flowchart | Online store social ...
- Call Center Data Flow Diagram
- Process Flowchart | Basic Flowchart Symbols and Meaning | Store ...


