This site uses cookies. By continuing to browse the ConceptDraw site you are agreeing to our Use of Site Cookies.

UML Use Case Diagram Example. Registration System

This sample was created in ConceptDraw DIAGRAM diagramming and vector drawing software using the UML Use Case Diagram library of the Rapid UML Solution from the Software Development area of ConceptDraw Solution Park. This sample shows the types of user’s interactions with the system and is used at the registration and working with the database system.

Data Flow Diagram (DFD)

A Data Flow Diagram (DFD) illustrates the flow of data through an information system, visualizes how the information is handled in terms of inputs and outputs, how the data enter to system and leave it. It is effective to use a Data Flow Diagram for creation the system's overview, to show the system's scope and boundaries. There are two different types of notations for DFDs: Yourdon-Coad and Gane-Sarson, which differ in visual representations for processes, data flow, data stores, external entities, etc. Thus, for example the processes are depicted as circles in Yourdon-Coad notation and as rounded squares in Gane-Sarson notation. Gane-Sarson notation is usually used for visualization information systems and Yourdon-Coad - for system analysis and design. The Data Flow Diagrams solution included to Software Development area of ConceptDraw Solution Park offers a lot of DFD templates, samples and examples, libraries of vector stencils for construction without efforts the DFDs according to both Gane-Sarson and Yourdon-Coad notations.

Types of Flowcharts

A Flowchart is a graphical representation of process, algorithm, workflow or step-by-step solution of the problem. It shows the steps as boxes of various kinds and connects them by arrows in a defined order depicting a flow. There are twelve main Flowchart types: Basic Flowchart, Business Process Modeling Diagram (BPMN), Cross Functional Flowchart, Data Flow Diagram (DFD), IDEF (Integrated DEFinition) Flowchart, Event-driven Process Chain (EPC) Diagram, Influence Diagram (ID), Swimlane Flowchart, Process Flow Diagram (PFD), Specification and Description Language (SDL) Diagram, Value Stream Mapping, Workflow Diagram. Using the Flowcharts solution from the Diagrams area of ConceptDraw Solution Park you can easy and quickly design a Flowchart of any of these types. This solution offers a lot of special predesigned vector symbols for each of these widely used notations. They will make the drawing process of Flowcharts much easier than ever. Pay also attention for the included collection of ready Flowchart examples, samples and quick-start templates. This is business process improvement tools. If you are looking for MS Visio for your Mac, then you are out of luck, because it hasn't been released yet. However, you can use Visio alternatives that can successfully replace its functions. ConceptDraw DIAGRAM is an alternative to MS Visio for Mac that provides powerful features and intuitive user interface for the same.
How to Simplify Flow Charting

Data Modeling Diagram

The vector stencils library Activity diagrams from the solution Rapid UML contains specific data modeling symbols for ConceptDraw DIAGRAM diagramming and vector drawing software. The Rapid UML solution is contained in the Software Development area of ConceptDraw Solution Park.

UML Diagram for System

This sample shows the UML Class Diagram of delivery system. On this diagram you can see the classes that are connected with aggregation and composition associations indicated with the multiplicity. This sample can be used by delivery services, postal services.

Software and Database Design with ConceptDraw DIAGRAM

Unified Modeling Language (abbr. UML) is a modeling language used by software developers and software engineers for developing diagrams, expressive modeling, visualization, construction, specification, and documentation an information about software-intensive systems. There are used many types of UML diagrams, joined in main groups, each of them has its own functional abilities and applications: Behaviour diagrams illustrate the functionality of software systems, Structuring diagrams depict a structure of objects at the systems, Interaction diagrams show the flow of control and data among the things in a modeling system. UML has a lot of practical applications in varied areas, among them software development, hardware design, banking and financial services, telecommunication, science, research, enterprise information system, distributed Web-based services, user interfaces for web applications, medical electronics, patient healthcare systems, etc. 
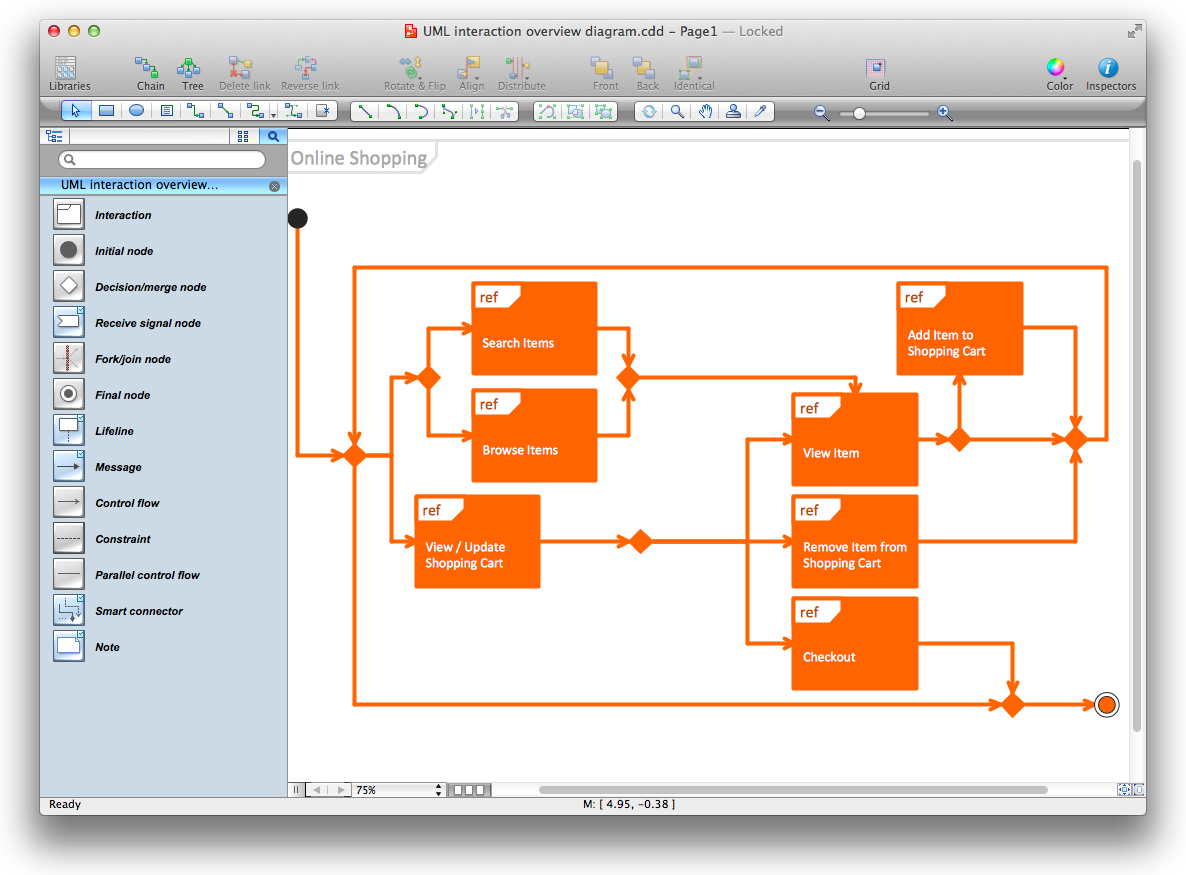
ConceptDraw DIAGRAM extended with Rapid UML solution is a perfect tool for UML diagramming.

Diagramming Software for Design UML Interaction Overview Diagrams

UML Interaction Overview Diagram schematically shows a control flow with nodes and a sequence of activities that can contain interaction or sequence diagrams.

Network Diagram Software Logical Network Diagram

Perfect Network Diagramming Software with examples of LAN Diagrams. ConceptDraw Network Diagram is ideal for network engineers and network designers who need to draw Logical Network diagrams.

Star Network Topology

Star is a basic computer network topology in which all nodes (computers and peripheral devices) of the network are connected to the central hub or switch with a point-to-point connection, forming a physical network segment. Such network segment can function separately or as a part of complex network topology. The switch is a server, the peripherals are the clients. The large workload and functions of network management are entrusted on the central computer, all information exchange goes through it, so it must to be obligatory the most powerful. The star network topology is a simple topology for design and implementation. Its advantages are high performance, flexible administration capabilities, simplicity of adding additional nodes and search of faults, the fact that a failure of one workstation doesn't affect the work of entire network. But the failure of central hub will result the failure of whole network or network segment - it's the main disadvantage. Use the ConceptDraw DIAGRAM with Computer and Networks solution to designing Star Network Topology Diagrams fast and easy.
Create Network Topology Diagram

Control and Information Architecture Diagrams (CIAD) with ConceptDraw DIAGRAM

One of the three main constituents of any enterprise is the Control and Information Architecture. The rest two are Production facilities and People and Organization.