This sample was created in ConceptDraw DIAGRAM diagramming and vector drawing software using the Computer and Networks solution from Computer and Networks area of ConceptDraw Solution Park.
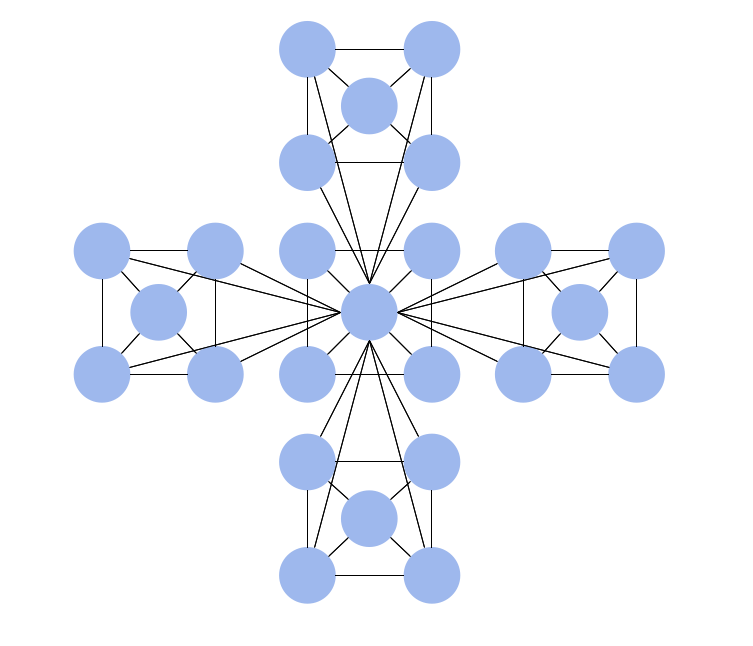
This sample shows the Hierarchical network topology.
A Hierarchical network topology interconnects multiple groups that are located on the separate layers to form a larger network. Each layer concentrates on the specified functions, this allows to choose the right equipment for the layer.
Pyramid diagrams help you visualize information as a triangle divided into horizontal slices. Labelled slices represent a hierarchy. Pyramids are used in marketing presentations to show and analyze hierarchy levels.
3D triangular diagram of DIKW pyramid has 6 levels: measurement, facts, data, information, knowledge, wisdom.
The data component include different scattered signs or symbols which are merely useless until these random objective facts are somehow processed. Data is a resource which has to be manipulated or rearranged to get useful. Information can be extracted from a pile of data, it also can be mined from different data storages.
A Venn-diagram style chart of the "project triangle" showing visually the potential overlaps between speed, quality and low cost, along with the "inability" to accomplish all three.
ConceptDraw DIAGRAM covers a broad spectrum of business graphics categories and offers at ConceptDraw STORE enormous online collection of pictorial examples and samples for different thematics and application areas. It is a plentiful source of inspiration and wonderful examples of professionally designed diagrams, flowcharts, UML diagrams, organizational charts, databases, ERDs, network diagrams, business charts, different thematic charts, schematics, infographics and plans developed specially for knowledge workers, engineers, managers, businessmen, marketing specialists, analytics, scientists, students, professors, journalists and also for a large number of other people that every day use various diagrams and drawings in their work and life activity.
Each of these examples is a real art, all they are well thought-out and designed without efforts with help of powerful tools of ConceptDraw DIAGRAM software. ConceptDraw examples display all variety of tasks, possibilities and results that ConceptDraw Product Line lets achieve fast and easy.
ConceptDraw is one of the best Visio alternatives for Mac. It open all Visio formats like.vsdx,.vss,.vdx files and allows you to export files to Visio formats.
The DIKW Pyramid refers loosely to a class of models for representing purported structural and/or functional relationships between data, information, knowledge, and wisdom.
A Data Flow Diagram (DFD) illustrates the flow of data through an information system, visualizes how the information is handled in terms of inputs and outputs, how the data enter to system and leave it. It is effective to use a Data Flow Diagram for creation the system's overview, to show the system's scope and boundaries. There are two different types of notations for DFDs: Yourdon-Coad and Gane-Sarson, which differ in visual representations for processes, data flow, data stores, external entities, etc. Thus, for example the processes are depicted as circles in Yourdon-Coad notation and as rounded squares in Gane-Sarson notation. Gane-Sarson notation is usually used for visualization information systems and Yourdon-Coad - for system analysis and design.
The Data Flow Diagrams solution included to Software Development area of ConceptDraw Solution Park offers a lot of DFD templates, samples and examples, libraries of vector stencils for construction without efforts the DFDs according to both Gane-Sarson and Yourdon-Coad notations.
A five level pyramid model of different types of Information Systems based on the information processing requirement of different levels in the organization.
five level pyramid example is included in the Pyramid Diagrams solution from Marketing area of ConceptDraw Solution Park.
Local Area Network (LAN) is a network which consists of computers and peripheral devices connected each other and to the local domain server, and covers a little territory or small number of buildings, such as home, school, laboratory, office, etc. LAN serves for few hundreds of users. It includes many cables and wires, and demands to design previously a Network diagram. All local area network devices can use the shared printers and disk storage.
ConceptDraw DIAGRAM is a perfect network diagramming software with examples of LAN Diagrams, templates and predesigned vector objects. ConceptDraw DIAGRAM is the ideal choice for network engineers and network designers who need to draw fast and easy Local Area Network Diagrams, for IT specialists, developers and other IT professionals which need to visualize the communication schemes of LAN and visually document the LAN's physical structure and arrangement in houses, offices and other buildings. Ready-to-use vector objects from Computer Network Diagrams solution will help you design LAN diagrams in minutes.
The main reason of using Process Flowchart or PFD is to show relations between major parts of the system. Process Flowcharts are used in process engineering and chemical industry where there is a requirement of depicting relationships between major components only and not include minor parts. Process Flowcharts for single unit or multiple units differ in their structure and implementation.
ConceptDraw DIAGRAM is Professional business process mapping software for making Process flowcharts, Process flow diagram, Workflow diagram, flowcharts and technical illustrations for business documents and also comprehensive visio for mac application. Easier define and document basic work and data flows, financial, production and quality management processes to increase efficiency of your business with ConcepDraw DIAGRAM. Business process mapping software with Flowchart Maker ConceptDraw DIAGRAM includes extensive drawing tools, rich examples and templates, process flowchart symbols and shape libraries, smart connectors that allow you create the flowcharts of complex processes, process flow diagrams, procedures and information exchange. Process Flowchart Solution is project management workflow tools which is part ConceptDraw Project marketing project management software.
Drawing charts, diagrams, and network layouts has long been the monopoly of Microsoft Visio, making Mac users to struggle when needing such visio alternative like visio for mac, it requires only to view features, make a minor edit to, or print a diagram or chart. Thankfully to MS Visio alternative like ConceptDraw DIAGRAM software, this is cross-platform charting and business process management tool, now visio alternative for making sort of visio diagram is not a problem anymore however many people still name it business process visio tools.
How To Create a Process Flow Chart (business process modelling techniques)


 diagram")


