Process Flowchart
The main reason of using Process Flowchart or PFD is to show relations between major parts of the system. Process Flowcharts are used in process engineering and chemical industry where there is a requirement of depicting relationships between major components only and not include minor parts. Process Flowcharts for single unit or multiple units differ in their structure and implementation. ConceptDraw PRO is Professional business process mapping software for making Process flowcharts, Process flow diagram, Workflow diagram, flowcharts and technical illustrations for business documents and also comprehensive visio for mac application. Easier define and document basic work and data flows, financial, production and quality management processes to increase efficiency of your business with ConcepDraw PRO. Business process mapping software with Flowchart Maker ConceptDraw PRO includes extensive drawing tools, rich examples and templates, process flowchart symbols and shape libraries, smart connectors that allow you create the flowcharts of complex processes, process flow diagrams, procedures and information exchange. Process Flowchart Solution is project management workflow tools which is part ConceptDraw Project marketing project management software. Drawing charts, diagrams, and network layouts has long been the monopoly of Microsoft Visio, making Mac users to struggle when needing such visio alternative like visio for mac, it requires only to view features, make a minor edit to, or print a diagram or chart. Thankfully to MS Visio alternative like ConceptDraw PRO software, this is cross-platform charting and business process management tool, now visio alternative for making sort of visio diagram is not a problem anymore however many people still name it business process visio tools.
HelpDesk
How to Input Data from MS Excel Into a Mind Map
Many people apply Excel documents to store data in the form of hierarchical lists. With ConceptDraw MINDMAP you can easily turn the linear structure of an Excel table in a radial structure of mind map ConceptDraw MINDMAP will create a mind map file (CDMZ) from your Excel (XLS) file. If you keep your information in the Microsoft Excel files, you can import them into ConceptDraw MINDMAP, converting the columns and rows to a hierarchical structured mind map. If you have multiple individual sheets in your Excel workbook, ConceptDraw MINDMAP will turn them into a single multi-page mind map. ConceptDraw MINDMAP lets you import an entire Microsoft® Excel file as well as insert data from the selected cells.Value Stream Mapping Template
Use ConceptDraw PRO extended with Value Stream Mapping solution for document processes with professional designed Value Stream Mapping template.How to exchange data files of major mind mapping software?
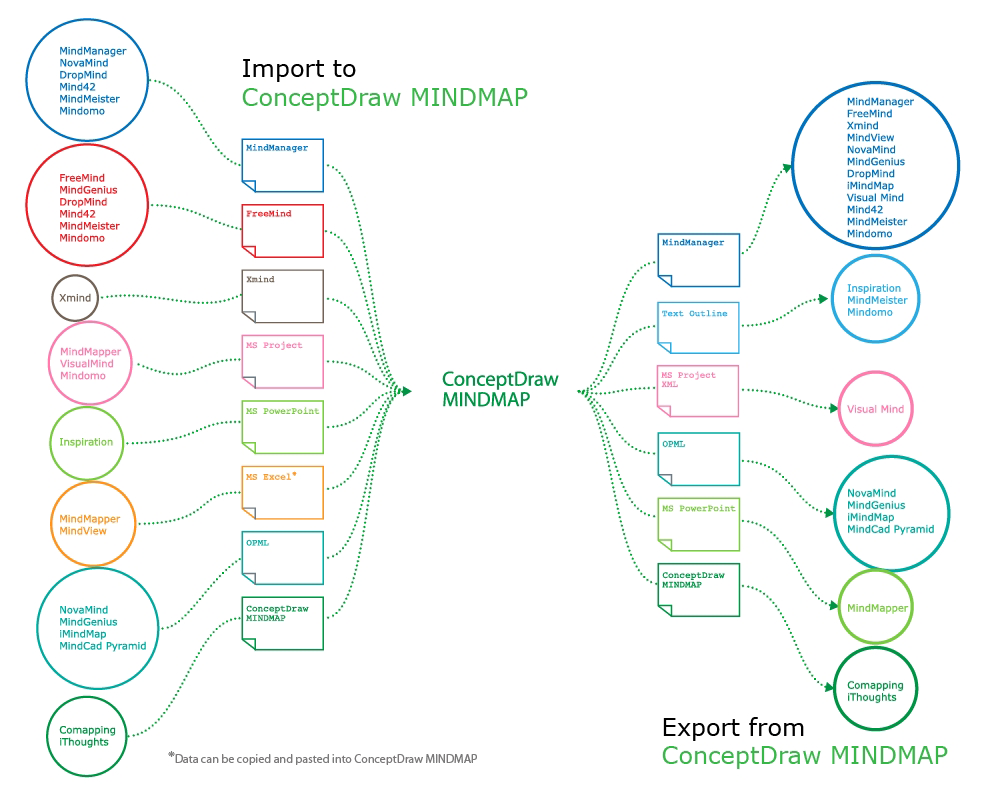
ConceptDraw MINDMAP software included to powerful ConceptDraw Office suite is applied for professional creation the Mind Maps, for effective managing the communications within the work group or team, for holding brainstorming sessions. The ability of exchanging the documents and files of different types, including Mind Maps is very useful for users that need to collaborate, but apply varied applications in their work. ConceptDraw MINDMAP supports the export to many Microsoft Office products, such as MS Word, MS PowerPoint, MS Project, as well as export to PDF, HTML, Evernote, Apple iCal, and different graphic format files. The Mind Map Exchange solution from the Collaboration area of ConceptDraw Solution Park makes the ConceptDraw MINDMAP software powerful in questions of exchanging the Mind Maps with large variety of major mind mapping applications, including Mindjet MindManager, FreeMind, XMind. If you can't to find some file format you need at the import / export list, you can refer to the third party applications to import or export the files through them.Best Mind Mapping Program for Making Presentations
ConceptDraw MINDMAP with the ability to import presentations from Microsoft PowerPoint, as well as enhancing its existing presentation capabilities.Value Stream Mapping Icons
The library with 40 vector stencils is included in the ConceptDraw Value Stream Mapping solution.Pie Chart Examples and Templates
A pie chart or a circle graph is a circular chart divided into sectors, illustrating numerical proportion. In a pie chart, the arc length of each sector and consequently its central angle and area, is proportional to the quantity it represents. Pie chart examples and templates created using ConceptDraw PRO software helps you get closer with pie charts and find pie chart examples suite your needs.
 Value Stream Mapping
Value stream mapping solution extends ConceptDraw PRO software with templates, samples and vector stencils for drawing the Value Stream Maps (VSM) in lean manufacturing practice.
 HR Dashboard
The HR Dashboard solution extends ConceptDraw PRO functionality with powerful drawing tools and great collection of comprehensive vector design elements, icons, pictograms and objects, navigation elements, live objects of HR charts, HR indicators, and thematic maps. The range of HR Dashboards applications is extensive, among them the human resource management, recruitment, hiring process, human resource development. ConceptDraw PRO software is perfect for creation HR Dashboard with any goal you need. It gives you all opportunities for designing not only informative, but also professional looking and attractive HR Dashboards of any style and degree of detalization, that are perfect for using in presentations, reports and other thematic documents.
Context Diagram Template
This template shows the Context Diagram. It was created in ConceptDraw PRO diagramming and vector drawing software using the Block Diagrams Solution from the “Diagrams” area of ConceptDraw Solution Park. The context diagram graphically identifies the system. external factors, and relations between them. It’s a high level view of the system. The context diagrams are widely used in software engineering and systems engineering for designing the systems that process the information.
- Designing Templates On Excel On Quality
- Excel Swimlane Template
- How to Input Data from MS Excel Into a Mind Map | Chemical and ...
- How to Input Data from MS Excel Into a Mind Map | How to Import ...
- Cause Mapping Template In Microsoft Excel
- Human Resource Process Mapping Template
- Time Function Map Template Excel
- Free Swim Lane Diagram Template Excel
- How to Input Data from MS Excel Into a Mind Map | How to ...


