HelpDesk
How to Connect a Live Object to a Text Data Source
Instruction on how to connect a ConceptDraw live object with data source files in TXT format to visualize the actual values of your performance metrics.
HelpDesk
How to Connect Tabular Data (CSV) to a Graphic Indicator on Your Live Dashboard
The Time Series Dashboard Solution can be used to create the interactive Time Series Charts as Column Charts, Line Charts, or Bar Charts for your interactive dashboard.Network Diagramming with ConceptDraw PRO
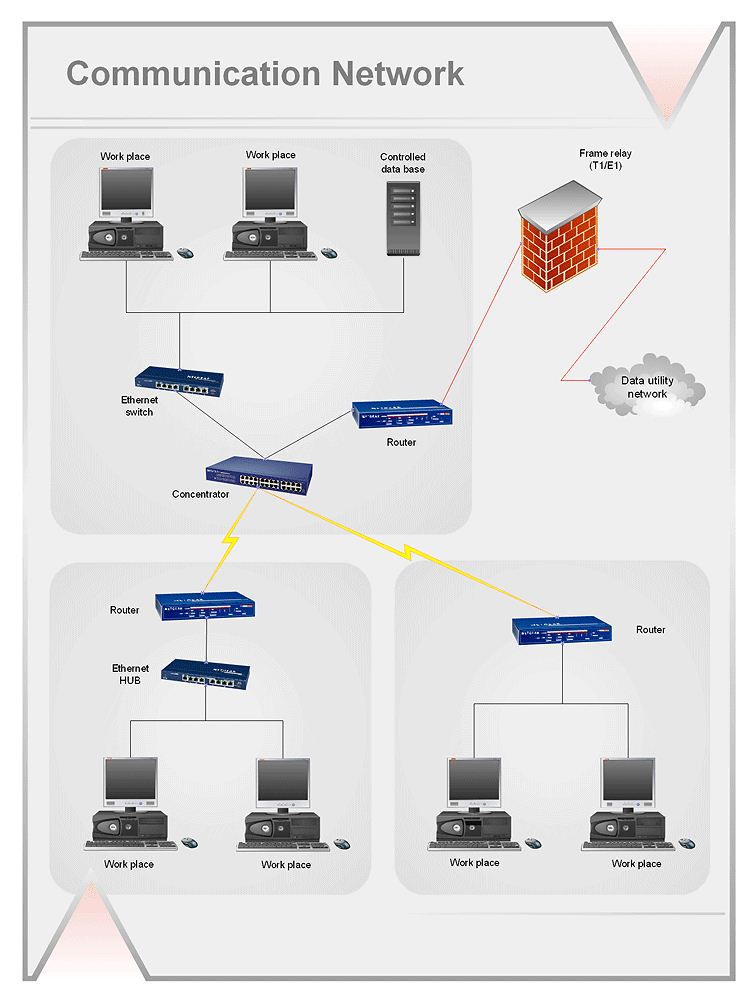
At the moment computer networks are widespread, various types of computer networks are constructed around the world, operate and interact with each other. There are many kinds of computer networks that differ in the transmission medium, in communications protocols, in size, topology, organizational intent, and also in territorial basis. There are popular such types of computer networks as Global Area Network (GAN), Wide Area Network (WAN), Metropolitan Area Network (MAN), Local Area Network (LAN). ConceptDraw PRO is a powerful network diagramming software, perfect for software engineers, software designers and software developers who need to draw Computer Network diagrams, designs, schematics, and network maps in no time. The pre-drawn shapes representing computers, network devices and smart connectors offered by ConceptDraw solutions help to create the accurate diagrams and documentation, represent computer network topologies and designs, depict Computer network architectures, logical, physical, cable networks, and vehicular networks.HelpDesk
How to Connect Text Data to a Time Series Chart on Your Live Dashboard
Time Series Dashboard means an integration of some type of diagrams: Line Charts, Bar Charts, Column Charts, and Dot Plots on a single space. The ConceptDraw Time Series Dashboard solution can be used to create the interactive Time Series dashboard. The libraries of Time Series Charts solution contain the Live Objects, that can change their appearance depending on the external data. Each chart from the Time Series dashboard displays particular source data. You can include Time Series Charts in your business or technical dashboards to show and compare the items changing over time.
HelpDesk
How to Use ConceptDraw Sales Dashboard Solution
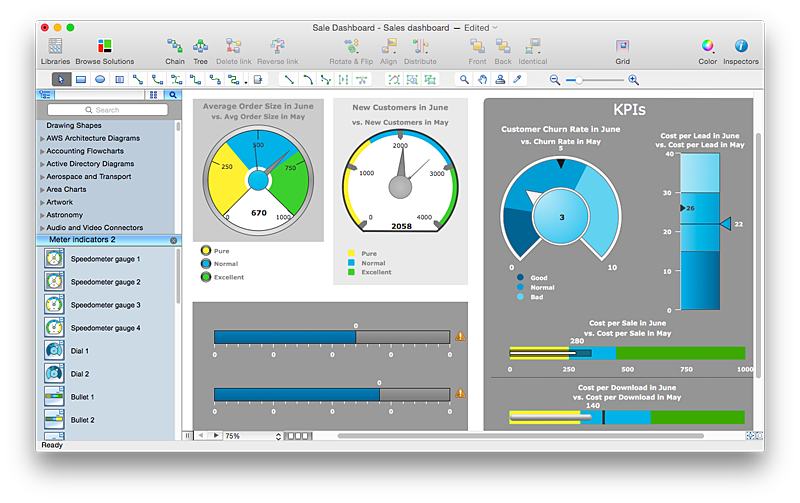
The interactive visual dashboard is a valuable tool for any sales team. Sales dashboard allows you to view and monitor sales indicators that are important for manager and sales staff . It helps to use the timely and reliable information to improve the quality of sales performance and increase sales revenues. ConceptDraw Sales Dashboard solution is a tool for both: sales manager and sales team. It provides the visualization of key performance indicators that are critical to the entire sales organization. The custom sales dashboard displays the real-time information on sales performance KPIs with the help of intuitive and easy-to-understand diagrams and charts. Sales Dashboard helps the entire team see where they are, and what needs to be done. With ConceptDraw PRO you can easily create a visual Sales Dashboard using Live Objects Technology.
HelpDesk
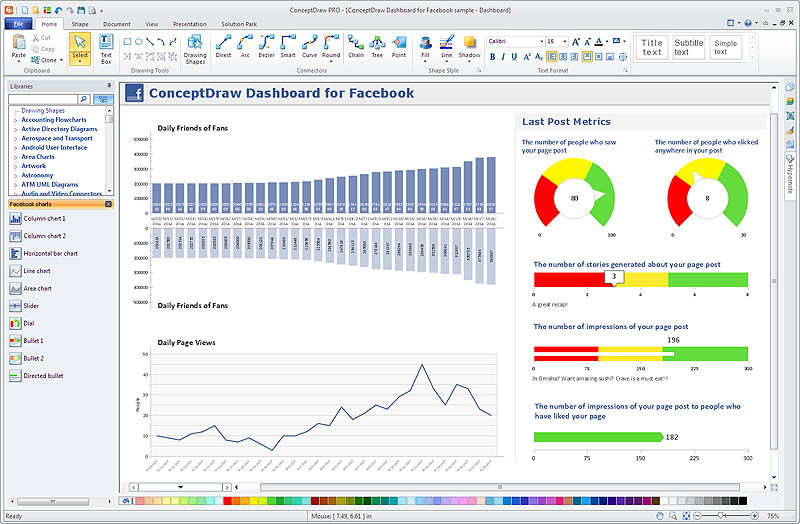
How to Use ConceptDraw Dashboard for Facebook on OS X
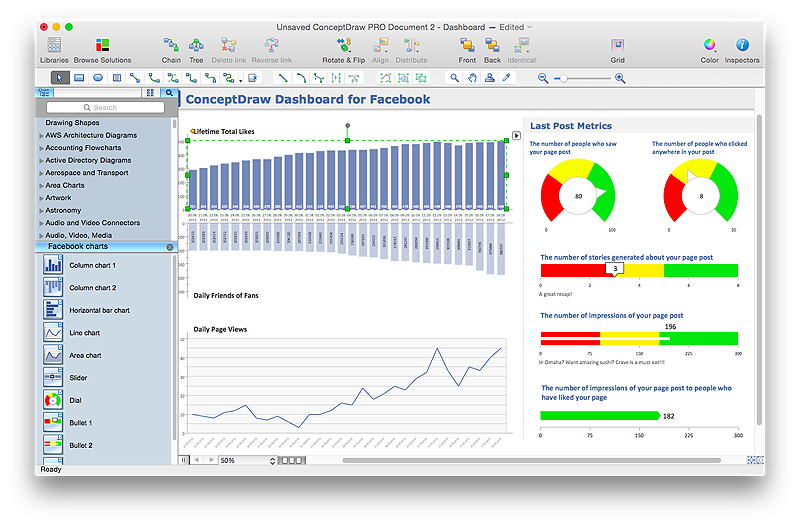
The ConceptDraw Dashboard for Facebook Solution is a visual dashboard that visualizes lifetime total Likes, daily Friends of Fans, and daily Page views based on the information exported from your Facebook Page.HelpDesk
How to Use ConceptDraw Dashboard for Facebook on PC
The ConceptDraw Dashboard for Facebook Solution is a visual dashboard that visualizes lifetime total Likes, daily Friends of Fans, and daily Page views based on the information exported from your Facebook Page.- SysML Diagram | SysML | Data Flow Diagrams | Open Source Uml ...
- SysML Diagram | SysML | Data Flow Diagrams | Open Source Uml ...
- How to Connect Dashboard with Text Data Source | How to Connect ...
- SysML Diagram | SysML | Data Flow Diagrams | Uml Diagram Tool ...
- SysML Diagram | SysML | Data Flow Diagrams | Uml Open Source
- Uml Diagram Open Source
- Data Flow Diagram
- Open Source Uml Diagram Tools
- Org Chart Software Open Source
- SysML Diagram | SysML | Vector stencils library - SysML diagrams ...
- Open Source Org Chart Software
- Data Flow Diagram
- Data structure diagram with ConceptDraw PRO | Express-G ...
- Visualize Sales Data Using Sample Data | Data Flow Diagram ...
- Process Flowchart | Business Process Elements: Data | Data Flow ...
- Hotel Network Topology Diagram | How to Create a Data Flow ...
- How to Connect Text Data to a Time Series Chart on Your Live ...
- Data Flow Diagrams | Process Flowchart | Visio Files and ...
- Examples of Flowcharts, Org Charts and More | Business diagrams ...
- Data flow Model Diagram
