Database Design
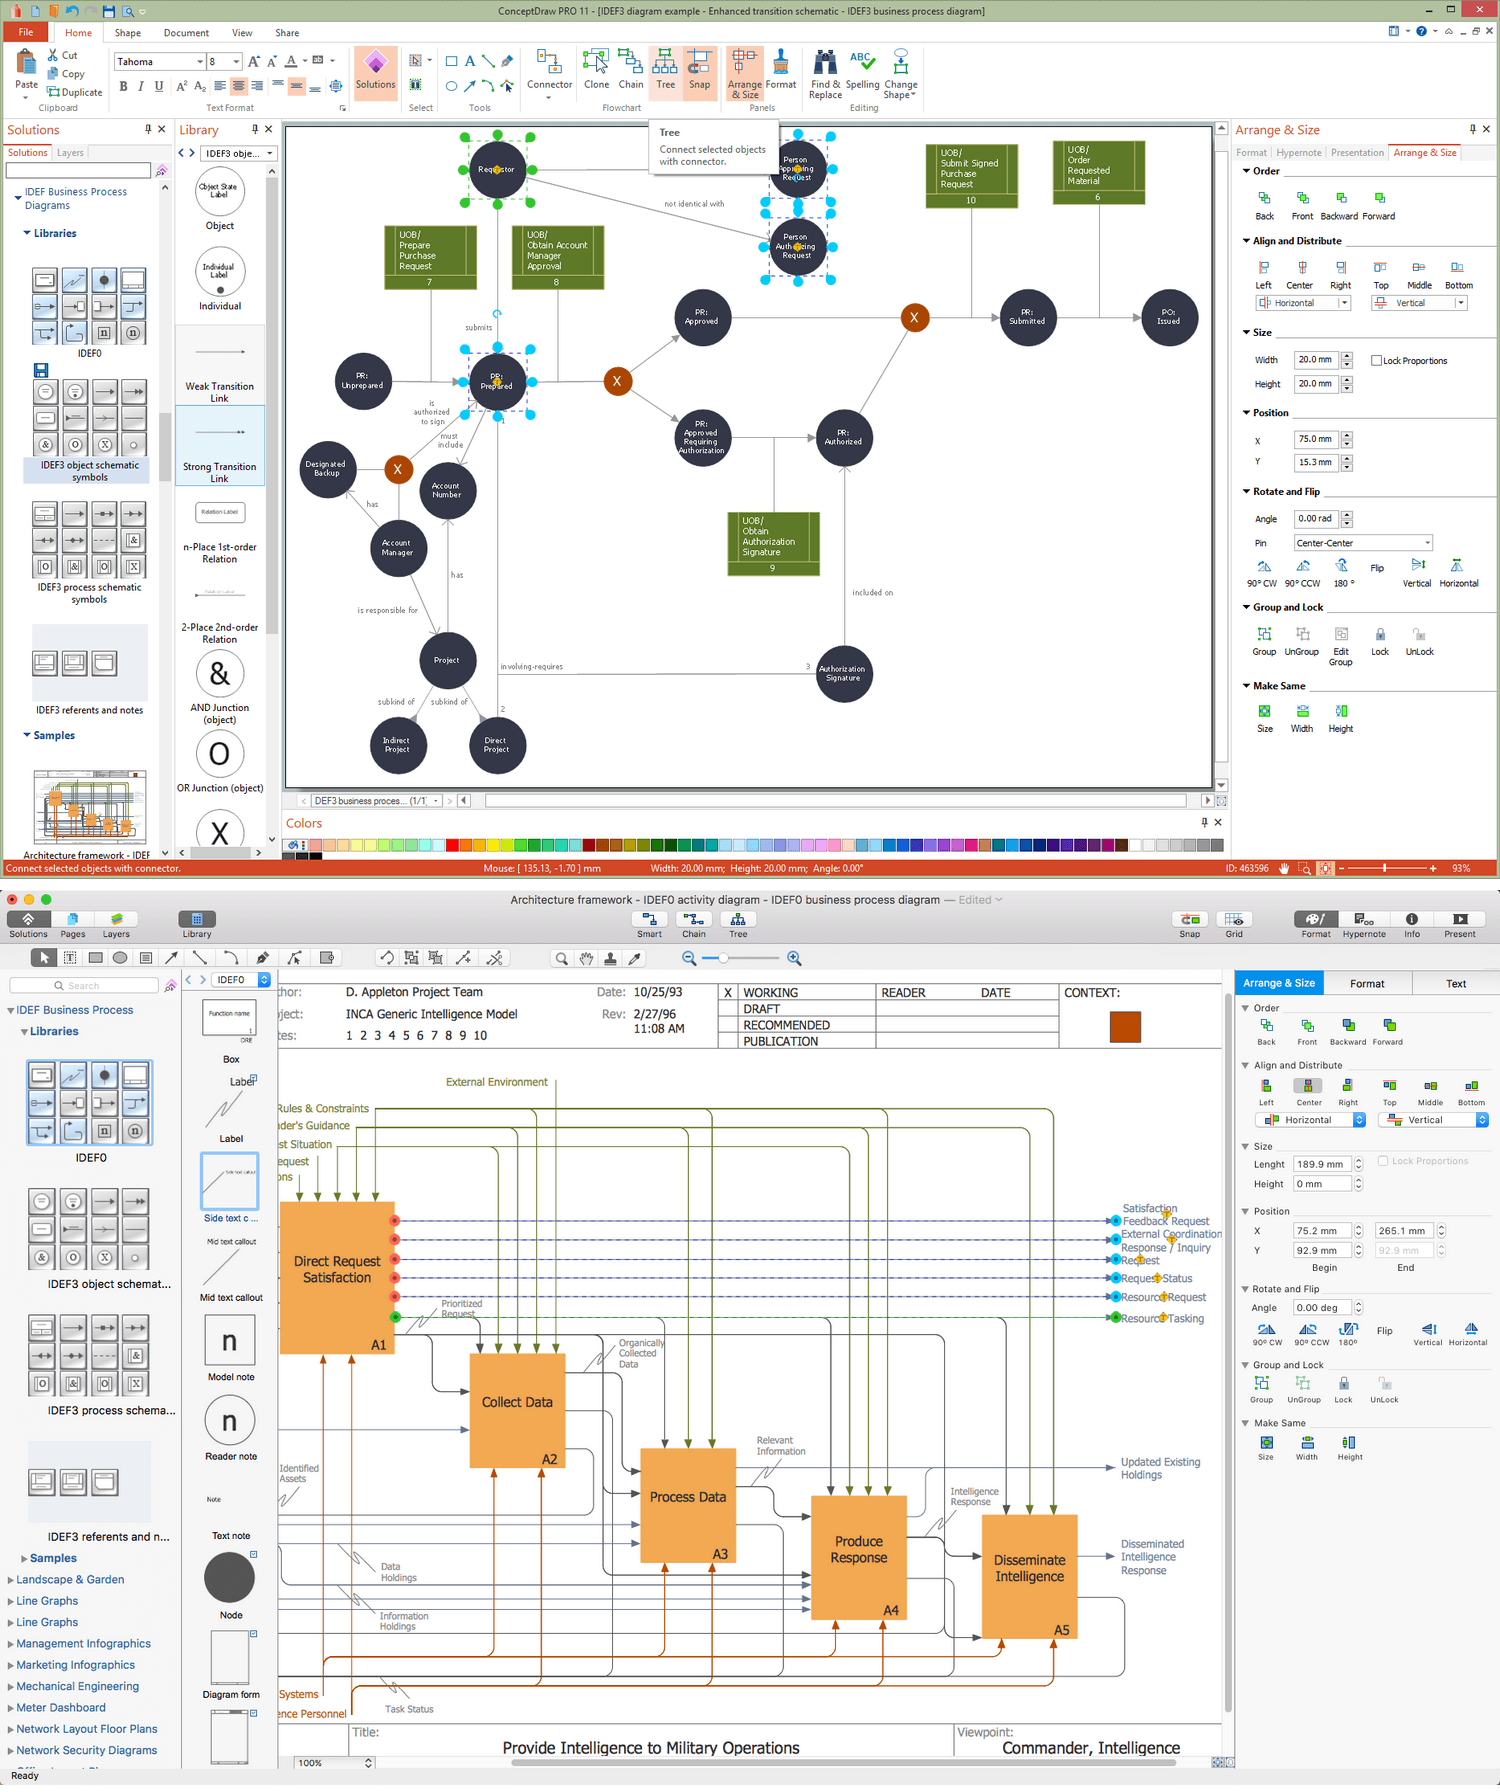
ConceptDraw DIAGRAM extended with IDEF Business Process Diagrams solution from the Business Processes area of ConceptDraw Solution Park is an ideal software for effective database design and drawing IDEF diagrams visually representing all steps of database design process.Computer Network Architecture. Computer and Network Examples
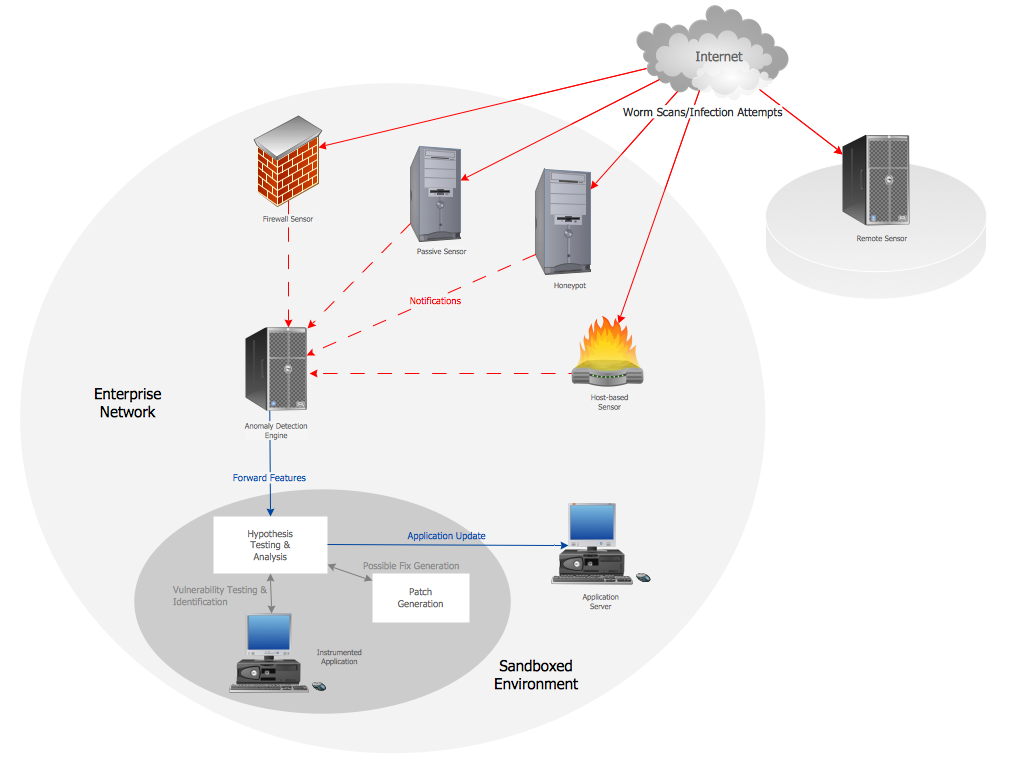
The network architecture and design specialization will help you gain the technical leadership skills you need to design and implement high-quality networks that support business needs.
Control and Information Architecture Diagrams (CIAD) with ConceptDraw DIAGRAM
One of the three main constituents of any enterprise is the Control and Information Architecture. The rest two are Production facilities and People and Organization.Entity Relationship Diagram Examples
Creation of Entity-Relationship (ER) model is a visual representation the structure of a business database, where data equates to entities or objects, which are linked by defined relationships expressing dependencies and requirements. By the nature, the ER model is an abstract visualization, a first step in design process towards creating a logical and functional database. ConceptDraw DIAGRAM professional software gives the ability to effectively describe a database using the Entity-Relationship model. Included to ConceptDraw Solution Park, the Entity-Relationship Diagram (ERD) solution contains the set of predesigned vector icons advocated by Chen's and Crow’s Foot notations that both can be used for data modeling and describing a database. Entity-Relationship Diagram (ERD) solution includes also helpful templates and incredibly large collection of varied Entity Relationship Diagram examples and samples offered at ConceptDraw STORE. Each of them can be used to develop your own model of a database of arbitrary complexity.
Diagramming software for Amazon Web Service icon set: Data Base
DataBase icons - Amazon AWS pro diagrams - AWS diagrams are part of architecturing tools provided with ConceptDraw Solution Park.
 AWS Architecture Diagrams
AWS Architecture Diagrams with powerful drawing tools and numerous predesigned Amazon icons and AWS simple icons is the best for creation the AWS Architecture Diagrams, describing the use of Amazon Web Services or Amazon Cloud Services, their application for development and implementation the systems running on the AWS infrastructure. The multifarious samples give you the good understanding of AWS platform, its structure, services, resources and features, wide opportunities, advantages and benefits from their use; solution’s templates are essential and helpful when designing, description and implementing the AWS infrastructure-based systems. Use them in technical documentation, advertising and marketing materials, in specifications, presentation slides, whitepapers, datasheets, posters, etc.
The vector stencils library "AWS Database" contains 31 Amazon Web Services database icons: Amazon DynamoDB icons, Amazon ElastiCache icons, Amazon Relational Database Service icons, Amazon Redshift icons, AWS Database Migration Service icons, Amazon DynamoDB Accelerator icon.
Use it to draw Amazon Web Services architecture diagrams with ConceptDraw PRO diagramming and vector drawing software.
"Amazon DynamoDB is a fast and flexible NoSQL database service... It is a fully managed cloud database and supports both document and key-value store models." [aws.amazon.com/ dynamodb/ ]
"ElastiCache is a web service that makes it easy to deploy, operate, and scale an in-memory cache in the cloud." [aws.amazon.com/ elasticache/ ]
"Amazon Relational Database Service (Amazon RDS) makes it easy to set up, operate, and scale a relational database in the cloud. ... Amazon RDS provides you six familiar database engines to choose from, including Amazon Aurora, Oracle, Microsoft SQL Server, PostgreSQL, MySQL and MariaDB." [aws.amazon.com/ rds/ ]
"Amazon Redshift is a fast, fully managed, petabyte-scale data warehouse that makes it simple and cost-effective to analyze all your data using your existing business intelligence tools." [aws.amazon.com/ redshift/ ]
"AWS Database Migration Service helps you migrate databases to AWS easily and securely." [aws.amazon.com/ dms/ ]
The AWS icons example "Design elements - AWS Database" is included in the AWS Architecture Diagrams solution from the Computer and Networks area of ConceptDraw Solution Park.
Diagramming Software for UML Composite Structure Diagrams
UML Composite Structure Diagram shows the internal structure of a class and the possible interactions at this structure.
Network Diagram Software Physical Network Diagram
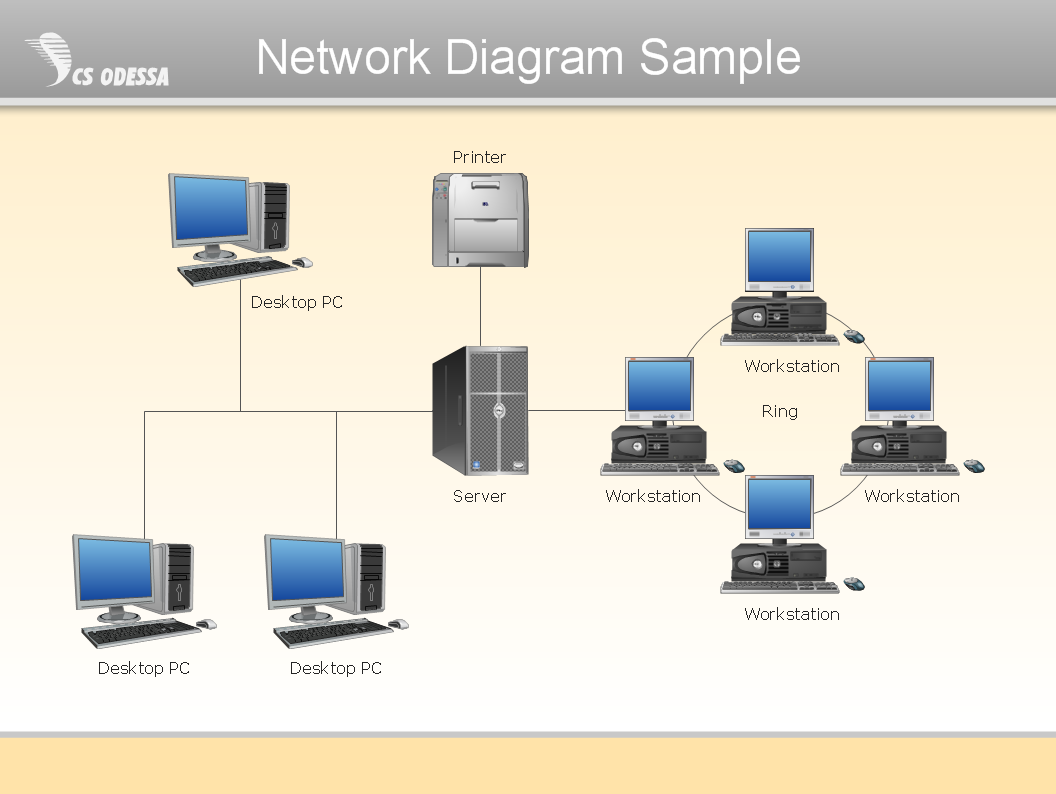
ConceptDraw Network Diagram Software is ideal for network engineers and network designers who need to draw Physical Network Diagrams.
This Azure cloud architecture pattern diagram template was created on the base of figure in the article "External Configuration Store Pattern" from the Microsoft Developer Network (MSDN) website.
"External Configuration Store Pattern.
Move configuration information out of the application deployment package to a centralized location. This pattern can provide opportunities for easier management and control of configuration data, and for sharing configuration data across applications and application instances. ...
The majority of application runtime environments include configuration information that is held in files deployed with the application, located within the application folders. In some cases it is possible to edit these files to change the behavior of the application after it has been deployed. However, in many cases, changes to the configuration require the application to be redeployed, resulting in unacceptable downtime and additional administrative overhead. ...
Store the configuration information in external storage, and provide an interface that can be used to quickly and efficiently read and update configuration settings. The type of external store depends on the hosting and runtime environment of the application. In a cloud-hosted scenario it is typically a cloud-based storage service, but could be a hosted database or other system.
The backing store chosen for configuration information should be fronted by a suitable interface that provides consistent and easy to use access in a controlled way that enables reuse. Ideally, it should expose the information in a correctly typed and structured format. The implementation may also need to authorize users’ access in order to protect configuration data, and be flexible enough to allow multiple versions of the configuration (such as development, staging, or production, and multiple release versions of each one) to be stored." [msdn.microsoft.com/ ru-RU/ library/ dn589803.aspx]
The Azure cloud system architecture diagram template "External Configuration Store Pattern" for the ConceptDraw PRO diagramming and vector drawing software is included in the Azure Architecture solutin from the Computer and Networks area of ConceptDraw Solution Park.
Entity Relationship Diagram - ERD - Software for Design Crows Foot ER Diagrams
ER-model is a data model which lets describe the conceptual schemes in a specific subject area. It can help to highlight the key entities and specify relationships that can be established between these entities. During the database design, it is realized the transformation of ER model into certain database scheme based on the chosen data model (relational, object, network, etc.). There are used two notations for ERDs: Crow's Foot and Chen's. Crow's Foot notation proposed by Gordon Everest represents the entity by rectangle containing its name (name must be unique within this model), and relation - by the line which links two entities involved in relationship. The relationship's plurality is graphically indicated by a "plug" on the end of the link, the optionality - by a circle. Entity-Relationship Diagrams based on Crow's Foot notation can be easily drawn using the ConceptDraw DIAGRAM. Extended with Entity-Relationship Diagram (ERD) solution, it is the best ERD diagrams software with powerful tools and ready design elements for Crow's Foot and Chen notations.
Entity-Relationship Diagram
Entity Relationship Diagram (ERD) is the world-known way to show the logical structure of databases in visual manner. The best software tool for drawing Entity-Relationship Diagram is ConceptDraw DIAGRAM ector graphics software with Entity-Relationship Diagram (ERD) solution from Software Development area which gives the ability to describe a database using the Entity-Relationship model. The vector graphic diagrams produced using this solution can be successfully used in whitepapers, presentations, datasheets, posters, or any technical materials.How to Draw EPC Diagram Quickly
An event-driven process chain diagram is a flowchart used in business process analysis. It evolved from Architecture of Integrated Information Systems (ARIS) and utilised in the business process improvement and analysis. It is also used to facilitate enterprise resource planning. An EPC diagram is a complex flowchart that shows different business processes through various workflows. The workflows are seen as functions and events that are connected by different teams or people, as well as tasks that allow business processes to be executed. ConceptDraw DIAGRAM is a software for making EPC diagrams that allows managers visually present business process models for making decisions for business.
Data Modeling Diagram
The vector stencils library Activity diagrams from the solution Rapid UML contains specific data modeling symbols for ConceptDraw DIAGRAM diagramming and vector drawing software. The Rapid UML solution is contained in the Software Development area of ConceptDraw Solution Park.- AWS Architecture Diagrams | Azure Architecture | ConceptDraw ...
- Example System Block Diagram Database Architecture
- Sample Web Server Database Architecture Diagram
- AWS Architecture Diagrams | Design elements - AWS Database ...
- Amazon Web Services | AWS Architecture Diagrams | AWS ...
- Architecture Diagram For Database Display System
- UML Diagram | AWS Architecture Diagrams | Entity Relationship ...
- Architectural Diagram With Elements Of Database
- Database Schema For Sport Management System
- AWS Database - Vector stencils library | AWS Architecture Diagrams ...
- Database Design | Logistics Flow Charts | AWS Architecture ...
- Introduction to Cloud Computing Architecture | ER Diagram for ...
- AWS Simple Icons for Architecture Diagrams | Design elements ...
- AWS Database - Vector stencils library | Design elements - AWS ...
- Microsoft Azure | Azure Architecture | Entity Relationship Diagram ...
- AWS Database - Vector stencils library | Azure Architecture | Taxi ...
- Flow chart Example. Warehouse Flowchart | Azure Architecture ...
- Software and Database Design with ConceptDraw PRO | UML ...
- Logistics Flow Charts | Database Design | AWS Architecture ...


_Win_Mac.png)


