How to create Floor Plan Design easy and effectively? You can invite an interior designer and trust this work to him, which is usually expensive and result may not always meet your expectations. Another way is to design it yourself, but at this case you need to have special skills, knowledges and abilities, among them basic knowledge of the composition rules, color theory, materials science and software for interior design development. The ability to use specialized software for drawing is especially valuable, useful and saves your time.
ConceptDraw DIAGRAM is one of the best among similar software, it offers extensive functionality, powerful tools, a lot of features, and is simple for using, so can be applied by everyone without efforts. Enhanced with Floor Plans and other solutions from the Building Plans area, the ConceptDraw DIAGRAM software helps easily create unique and harmonious interior designs, and draw in desired scale professional-looking Floor Plans and Layouts for homes, apartments, hotels, offices, and other buildings.
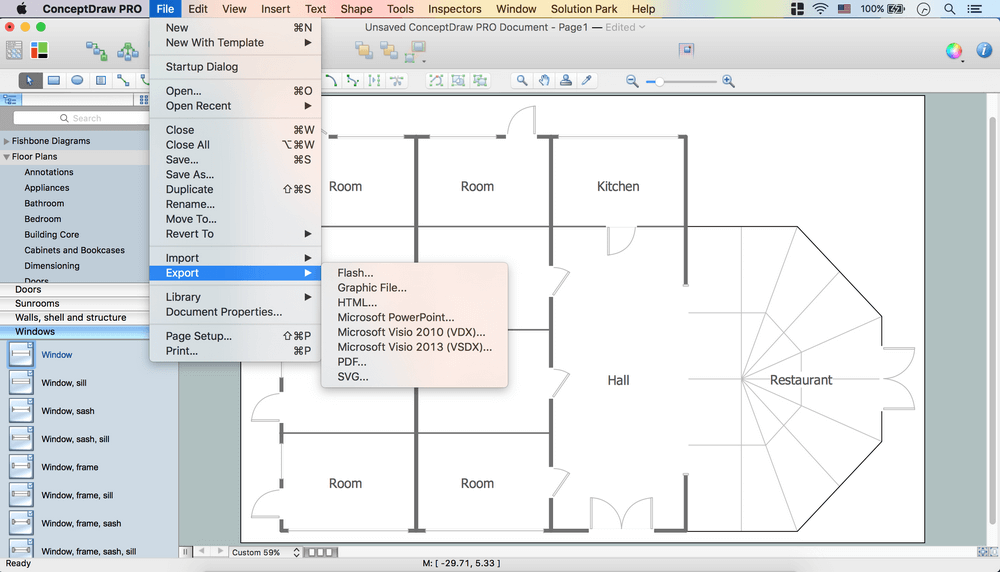
ConceptDraw DIAGRAM is a full Visio compatibility and better alternative for students, teachers and business professionals to reliably create kinds of flowcharts, organizational charts, network diagrams, floor plans, electrical diagrams, software design diagrams, maps and more.


_Win_Mac.png)


