 Data Flow Diagrams (DFD)
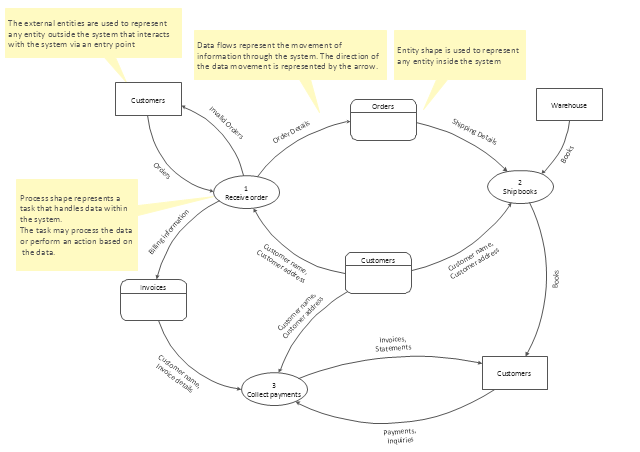
Data Flow Diagrams solution extends ConceptDraw DIAGRAM software with templates, samples and libraries of vector stencils for drawing the data flow diagrams (DFD).
Data Flow Diagrams (DFD) visualize data flows in information systems.
They show: what kinds of data input to and output from the system; where the data come from and go to; where the data is stored.
DFDs are used for design and analysis of business and engineering information systems.
They are also used for data processing visualization.
They show: what kinds of data input to and output from the system; where the data come from and go to; where the data is stored.
DFDs are used for design and analysis of business and engineering information systems.
They are also used for data processing visualization.
The Data flow diagram (DFD) example "Payment for goods using UPS code scanner" shows data flow in process of payment for goods in the shop using the MaxiCode scanner.
"MaxiCode is a public domain, machine-readable symbol system originally created and used by United Parcel Service. Suitable for tracking and managing the shipment of packages, it resembles a barcode, but uses dots arranged in a hexagonal grid instead of bars. MaxiCode has been standardised under ISO/ IEC 16023.
A MaxiCode symbol (internally called "Bird's Eye", "Target", "dense code", or "UPS code") appears as a 1 inch square, with a bullseye in the middle, surrounded by a pattern of hexagonal dots. It can store about 93 characters of information, and up to 8 MaxiCode symbols can be chained together to convey more data. The centered symmetrical bullseye is useful in automatic symbol location regardless of orientation, and it allows MaxiCode symbols to be scanned even on a package traveling rapidly." [MaxiCode. Wikipedia]
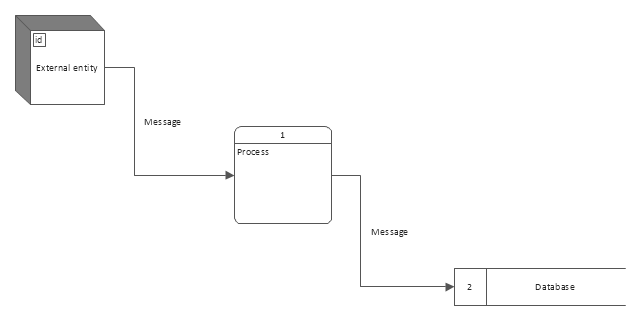
This example of data flow diagram (Gane & Sarson notation) was created using the ConceptDraw PRO diagramming and vector drawing software extended with the Data Flow Diagrams solution from the Software Development area of ConceptDraw Solution Park.
Data structure diagram with ConceptDraw DIAGRAM
Data structure diagram (DSD) is intended for description of conceptual models of data (concepts and connections between them) in the graphic format for more obviousness. Data structure diagram includes entities description, connections between them and obligatory conditions and requirements which connect them. Create Data structure diagram with ConceptDraw DIAGRAM.Business diagrams & Org Charts with ConceptDraw DIAGRAM
The business diagrams are in great demand, they describe the business processes, business tasks and activities which are executed to achieve specific organizational and business goals, increase productivity, reduce costs and errors. They let research and better understand the business processes. ConceptDraw DIAGRAM is a powerful professional cross-platform business graphics and business flowcharting tool which contains hundreds of built-in collections of task-specific vector stencils and templates. They will help you to visualize and structure information, create various Business flowcharts, maps and diagrams with minimal efforts, and add them to your documents and presentations to make them successful. Among them are Data flow diagrams, Organization charts, Business process workflow diagrams, Audit flowcharts, Cause and Effect diagrams, IDEF business process diagrams, Cross-functional flowcharts, PERT charts, Timeline diagrams, Calendars, Marketing diagrams, Pyramids, Target diagrams, Venn diagrams, Comparison charts, Analysis charts, Dashboards, and many more. Being a cross-platform application, ConceptDraw DIAGRAM is very secure, handy, free of bloatware and one of the best alternatives to Visio for Mac users.
Garrett IA Diagrams with ConceptDraw DIAGRAM
Garrett IA diagrams are used at development of Internet-resources, in particulars at projecting of interactions of web-resource elements. The diagram of information architecture of the web resource which is constructed correctly with necessary details presents to developers the resource in comprehensible and visual way.Use this template to create your data flow diagrams (DFD) by Gane-Sarson (DFD) notation using the ConceptDraw PRO diagramming and vector drawing software extended with the Data Flow Diagrams solution from the Software Development area of ConceptDraw Solution Park.
ConceptDraw DIAGRAM DFD Software
Our DFD software ConceptDraw DIAGRAM allows you to quickly create DFD with data storages, external entities, functional transforms, data flows, as well as control transforms and signals. DFD program ConceptDraw DIAGRAM has hundreds of templates, and a wide range of libraries with all nesassary ready-made drag-and-drop.Control and Information Architecture Diagrams (CIAD) with ConceptDraw DIAGRAM
One of the three main constituents of any enterprise is the Control and Information Architecture. The rest two are Production facilities and People and Organization.- Data Flow Diagrams
- Data Flow Diagrams
- Data Flow Diagrams
- Data Flow Diagrams with ConceptDraw PRO | Flow Diagram ...
- Data Flow Diagrams | ConceptDraw PRO The best Business ...
- Data Flow Diagrams with ConceptDraw PRO
- Data Flow Diagrams | Flow Chart Diagram Examples | Data Flow ...
- Data flow diagram template
- Data flow diagram template | Software and Database Design with ...
- Data Flow Diagrams | Business diagrams & Org Charts with ...
- Data Flow Diagrams | ConceptDraw PRO DFD Software
- Data Flow Diagrams with ConceptDraw PRO | Interactive Voice ...
- Data Flow Diagrams with ConceptDraw PRO | Process Flowchart ...
- Data Flow Diagrams | Development of software with ConceptDraw ...
- Data Flow Diagrams | Software and Database Design with ...
- Cross-Functional Flowchart
- Diagram Flow Chart | Good Flow Chart app for Mac | Data Flow ...
- Data Flow Diagrams | Cross-Functional Flowcharts
- Cross-Functional Flowcharts</nobr> | Data Flow Diagrams ...
- Flowcharts | Cross-Functional Process Map Template | Data Flow ...

---payment-for-goods-using-ups-code-scanner.png--diagram-flowchart-example.png)


