Decision Making
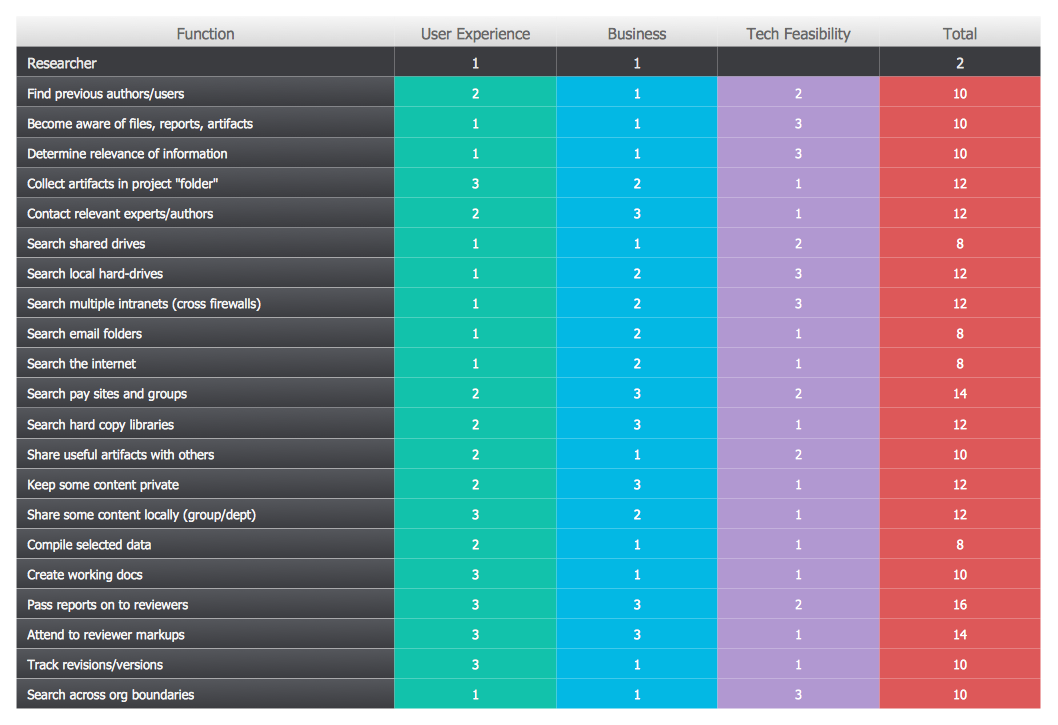
Decision Making - ConceptDraw Office suite provides visual tools that are given support on the stage of the decision making. The Seven Management and Planning Tools is a set for such diagrams: Affinity Diagram, Relations Diagram, Prioritization Matrix, Root Cause Tree Diagram, Involvement Matrix, PERT Chart, Risk Diagram (PDPC).
CORRECTIVE ACTIONS PLANNING. Risk Diagram (PDPC)
Risk Diagram (PDPC) - ConceptDraw Office suite is a software for Risks Diagram making. This diagram identifies possible risks in accomplishing corrective actions. With the Risks Diagram, one analyzes each action separately in a tree of all actions and develops a preventive action in response of each potential obstacles or circumstances which may be a risk.
The Action Plan
Action Plan - For the action planning define people and groups involvement in corrective actions by roles, identify logical sequences of scheduled actions and critical path of problem solving, identify possible risks of action plan and propose preventive actions. ConceptDraw Office suite is a software for decision making and action plan.
Decision Making Software For Small Business
A software tool that saves your time on making decisions now has the ability to make decisions with remote team via Skype.
Corrective Action Planning
One of the stages of the problem's solving process scenario is Corrective Action Planning. Corrective action planning define people and groups involvement in corrective actions by roles, identify logical sequences of scheduled actions and critical path of problem solving, identify possible risks of action plan and propose preventive actions.
Cause and Effect Analysis
Cause and Effect Analysis - The Seven Management and Planning Tools is a tool for Cause and Effect Analysis that allows users to analyze the root causes for factors that influenced the problem. This diagram is constructed separately for each highly prioritized factor. The Diagram is then used for further formulation of potential actions.
PROBLEM ANALYSIS. Root Cause Analysis Tree Diagram
Root Cause Analysis Tree Diagram. Use the Root Cause Diagram to perform visual root cause analysis. Root Cause Analysis Tree Diagram is constructed separately for each highly prioritized factor. The goal of this is to find the root causes for the factor and list possible corrective action. ConceptDraw Office suite is a software for problem analysis.
Total Quality Management Business Diagram
The Total Quality Management Diagram solution helps you and your organization visualize business and industrial processes. Create Total Quality Management diagrams for business process with ConceptDraw software.Root Cause Analysis
The Seven Management and Planning Tools is a tool for Root Cause Analysis Tree Diagram drawing. This diagram is for Root Cause Analysis. Analyze the root causes for factors that influenced the problem. This diagram is constructed separately for each highly prioritized factor. The goal of this is to find the root causes for the factor and list possible corrective action.
Root Cause Tree Diagram
The Root Cause Tree Diagram is a chart that helps determine the root causes of factors that influence the problem, to represent and analyze them. This diagram is constructed separately for each high priority factor. First it is needed to identify the root causes for a factor, display their structure and then propose the possible corrective actions. But how to create Root Cause Tree Diagram with the least efforts and time? ConceptDraw MINDMAP will effectively help you in drawing MINDMAP Root Cause Tree Diagram and Root Cause Analysis Tree Diagram used for further formulation of actions. The Root Cause Tree Diagram template, which can be opened at the program from the Input tab, supplies you with a basic mind map structure for your diagram. The central idea describes briefly a problem, the main topics represent the high-level causes of a problem, their subtopics give more details about the different parts of given causes. At the last level of tree are described the potential solutions to each of detailed parts of the causes.Mac Tools - SWOT Analysis
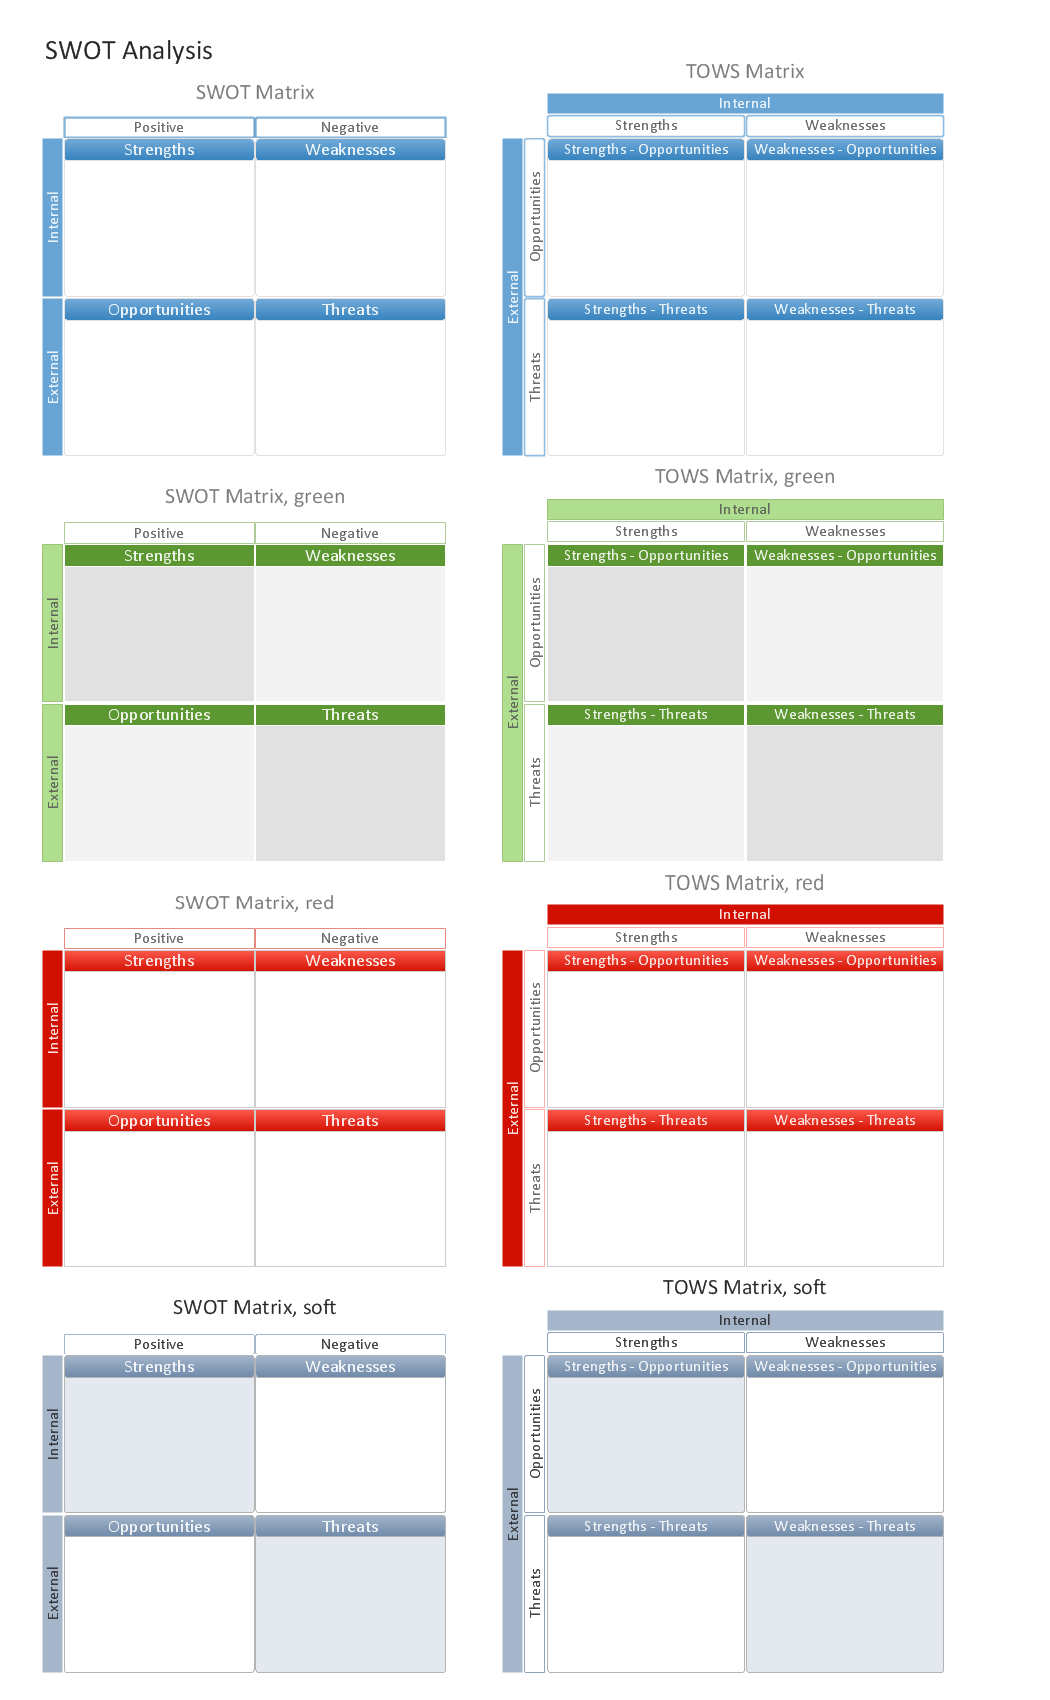
The SWOT analysis is a well-known method of the making a plan to identify and to evaluate the Strengths, Weaknesses, Opportunities, Threats that are involved in a project. The SWOT analysis involves obligatory specifying the objective of a project and identifying the internal and external causes allowing to accomplish the goals of a business or project. When making the analysis the decision makers should consider whether the objective is attainable. If not, the process is repeated and another objective can be selected. Among a lot of professional opportunities of ConceptDraw DIAGRAM diagramming and vector drawing software are also the Mac tools for holding the SWOT analysis and drawing the SWOT Analysis Diagrams and SWOT Matrices. The SWOT and TOWS Matrix Diagrams solution offered by the Management area at ConceptDraw Solution Park includes large variety of SWOT matrix samples and templates allowing the ConceptDraw DIAGRAM users to create own SWOT and TOWS diagrams fast and easy on both Mac and PC.Venn Diagram Examples for Problem Solving. Venn Diagram as a Truth Table
Venn diagrams are illustrations used in the branch of mathematics known as set theory. They show the mathematical or logical relationship between different groups of things (sets). A Venn diagram shows all the possible logical relations between the sets.Activity Network (PERT) Chart
Activity Network and Project Evaluation and Review Technique, or PERT, charts are a way of documenting and analyzing the tasks in a project. This diagram is constructed as part of the process in creating a schedule of corrective actions. The Activity Network Chart (PERT) shows the logical connections and consequence of tasks to be performed. It displays the time period for problem solving and the implementation of all activities through the critical path.Preventive Action
Preventive Action - ConceptDraw Office suite is a software for the Preventive Action making. The Seven Management and Planning Tools solution is a set of such tools for problems preventive actions via investigating of the core problem. Skilled use of these diagrams makes collaborative teamwork both more engaging and more effective.
PDPC
ConceptDraw DIAGRAM extended with Seven Management and Planning Tools Solution from the Management Area of ConceptDraw Solution Park is the best software for drawing all types of diagrams from the Seven Management and Planning Tools: Affinity Diagram, Relations Diagram, Prioritization Matrix, Root Cause Analysis Tree Diagram, Involvement Matrix, PERT Chart, and Risk Diagram (PDPC).- Decision tree diagram | Decision Making | Influence Diagram ...
- Decision Making Tree Diagram In Management
- Decision Making | Block diagram - Customer decision making ...
- Decision Making | CORRECTIVE ACTIONS PLANNING. Risk ...
- Decision tree diagram | Decision Making | Influence Diagram ...
- Process Flowchart | Decision Making | CORRECTIVE ACTIONS ...
- Root cause analysis tree diagram - Template | PROBLEM ...
- Tree Diagram In Decision Making
- PROBLEM ANALYSIS. Root Cause Analysis Tree Diagram ...
- Decision Making | How To Make the Right Decision in Projects ...
- Decision Making | Corrective Action Planning | CORRECTIVE ...
- Influence Diagram Software | Decision Making | Cross-Functional ...
- Root Cause Analysis | Mac Tools - SWOT Analysis | Decision ...
- PROBLEM ANALYSIS. Root Cause Analysis Tree Diagram ...
- Diagram Chart Of Managerial Decision Making
- Decision Making
- Root cause analysis tree diagram - Manufacturing problem solution ...
- PROBLEM ANALYSIS. Root Cause Analysis Tree Diagram | How to ...
- Accident analytic tree - FTA diagram | Decision Making | How To use ...
- Decision Making | Block diagram - Customer decision making ...


