, t chart, decision matrix, decision tree analysis") Decision Making
Decision Making
The Decision Making solution offers the set of professionally developed examples, powerful drawing tools and a wide range of libraries with specific ready-made vector decision icons, decision pictograms, decision flowchart elements, decision tree icons, decision signs arrows, and callouts, allowing the decision maker (even without drawing and design skills) to easily construct Decision diagrams, Business decision maps, Decision flowcharts, Decision trees, Decision matrix, T Chart, Influence diagrams, which are powerful in questions of decision making, holding decision tree analysis and Analytic Hierarchy Process (AHP), visual decomposition the decision problem into hierarchy of easily comprehensible sub-problems and solving them without any efforts.
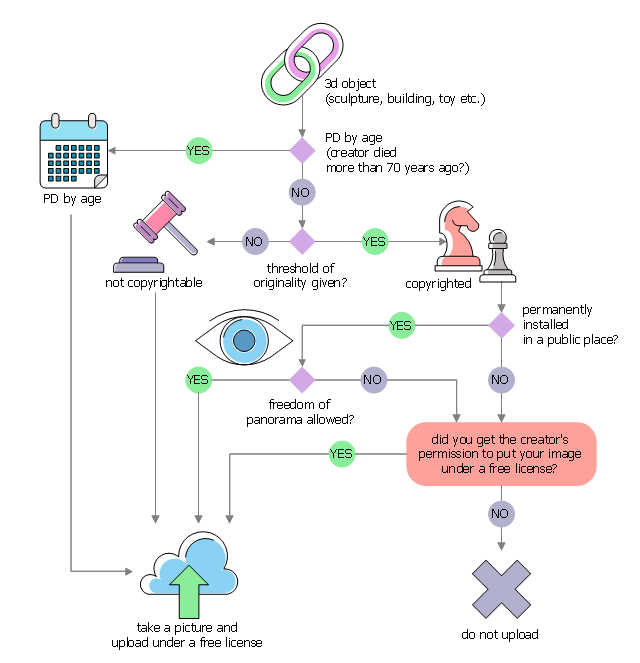
This example was designed on the base of the Wikimedia Commons file: Derivative Works Decision Tree.svg.
"Decision tree for authorization (or not) of derivative works on Commons"
[commons.wikimedia.org/ wiki/ File:Derivative_ Works_ Decision_ Tree.svg]
"Wikimedia Commons is a shared free image repository. Rather than uploading the same image to some 720 wikis individually, images can be uploaded to commons and can be used from every wiki. This both saves time and server resources." [Wikipedia:Commons Upload Campaign. Wikipedia]
The diagram example "Derivative works decision tree" was designed using ConceptDraw software extended with Decision Making solution from Management area of ConceptDraw Solution Park.
Decision diagram example
Influence Diagram

HelpDesk
How to Draw a Decision-Making Diagram

 Block Diagrams
Block diagrams solution extends ConceptDraw DIAGRAM software with templates, samples and libraries of vector stencils for drawing the block diagrams.
 Marketing Diagrams
Marketing Diagrams solution extends ConceptDraw DIAGRAM diagramming software with abundance of samples, templates and vector design elements intended for easy graphical visualization and drawing different types of Marketing diagrams and graphs, including Branding Strategies Diagram, Five Forces Model Diagram, Decision Tree Diagram, Puzzle Diagram, Step Diagram, Process Chart, Strategy Map, Funnel Diagram, Value Chain Diagram, Ladder of Customer Loyalty Diagram, Leaky Bucket Diagram, Promotional Mix Diagram, Service-Goods Continuum Diagram, Six Markets Model Diagram, Sources of Customer Satisfaction Diagram, etc. Analyze effectively the marketing activity of your company and apply the optimal marketing methods with ConceptDraw DIAGRAM software.
Basic Flowchart Symbols and Meaning


 Basic Circle-Spoke Diagrams
Basic circle-spoke diagrams are well suited for marketing, management documents, and presentations.
PDPC

Entity Relationship Diagram Symbols

- Decision tree diagram | Decision Making | Fault Tree Diagram ...
- Decision Making | Decision tree diagram | Influence Diagram ...
- Decision tree diagram | IDEF1X Standard | Decision Tree Nodes
- Decision tree diagram | How to Draw Business Process Diagrams ...
- Decision tree diagram | Marketing Diagrams | MS Visio Look a Like ...
- Decision tree diagram | Fault Tree Diagram | Influence Diagram ...
- Decision tree diagram | Decision Making | Cause and Effect Analysis ...
- Decision tree diagram | Marketing Diagrams | Top 5 Android Flow ...
- Decision tree diagram | Fault Tree Diagram | Marketing Charts ...