, t chart, decision matrix, decision tree analysis") Decision Making
Decision Making
The Decision Making solution offers the set of professionally developed examples, powerful drawing tools and a wide range of libraries with specific ready-made vector decision icons, decision pictograms, decision flowchart elements, decision tree icons, decision signs arrows, and callouts, allowing the decision maker (even without drawing and design skills) to easily construct Decision diagrams, Business decision maps, Decision flowcharts, Decision trees, Decision matrix, T Chart, Influence diagrams, which are powerful in questions of decision making, holding decision tree analysis and Analytic Hierarchy Process (AHP), visual decomposition the decision problem into hierarchy of easily comprehensible sub-problems and solving them without any efforts.
Cross-Functional Flowchart


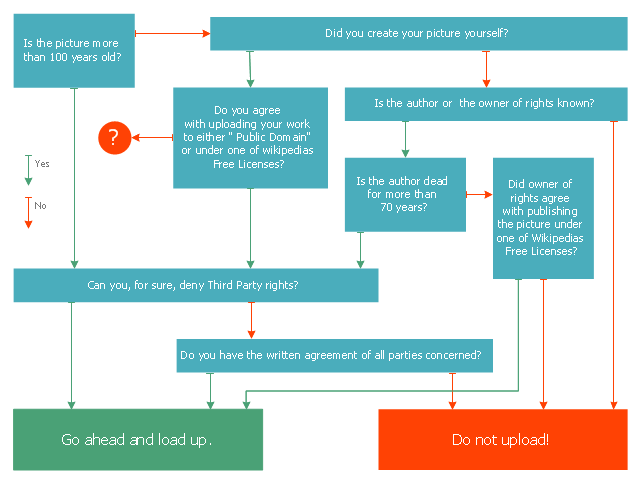
This marketing diagram sample represents decision tree. It was redesigned from the Wikimedia Commons file: Decision Tree on Uploading Imagesv2.svg.
[commons.wikimedia.org/ wiki/ File:Decision_ Tree_ on_ Uploading_ Imagesv2.svg]
"A decision tree is a decision support tool that uses a tree-like graph or model of decisions and their possible consequences, including chance event outcomes, resource costs, and utility. It is one way to display an algorithm.
Decision trees are commonly used in operations research, specifically in decision analysis, to help identify a strategy most likely to reach a goal. ...
A decision tree is a flowchart-like structure in which internal node represents test on an attribute, each branch represents outcome of test and each leaf node represents class label (decision taken after computing all attributes). A path from root to leaf represents classification rules.
In decision analysis a decision tree and the closely related influence diagram is used as a visual and analytical decision support tool, where the expected values (or expected utility) of competing alternatives are calculated.
A decision tree consists of 3 types of nodes:
(1) Decision nodes - commonly represented by squares.
(2) Chance nodes - represented by circles.
(3) End nodes - represented by triangles.
Decision trees are commonly used in operations research, specifically in decision analysis, to help identify a strategy most likely to reach a goal." [Decision tree. Wikipedia]
The marketing diagram example "Decision tree" was created using the ConceptDraw PRO diagramming and vector drawing software extended with the Marketing Diagrams solution from the Marketing area of ConceptDraw Solution Park.
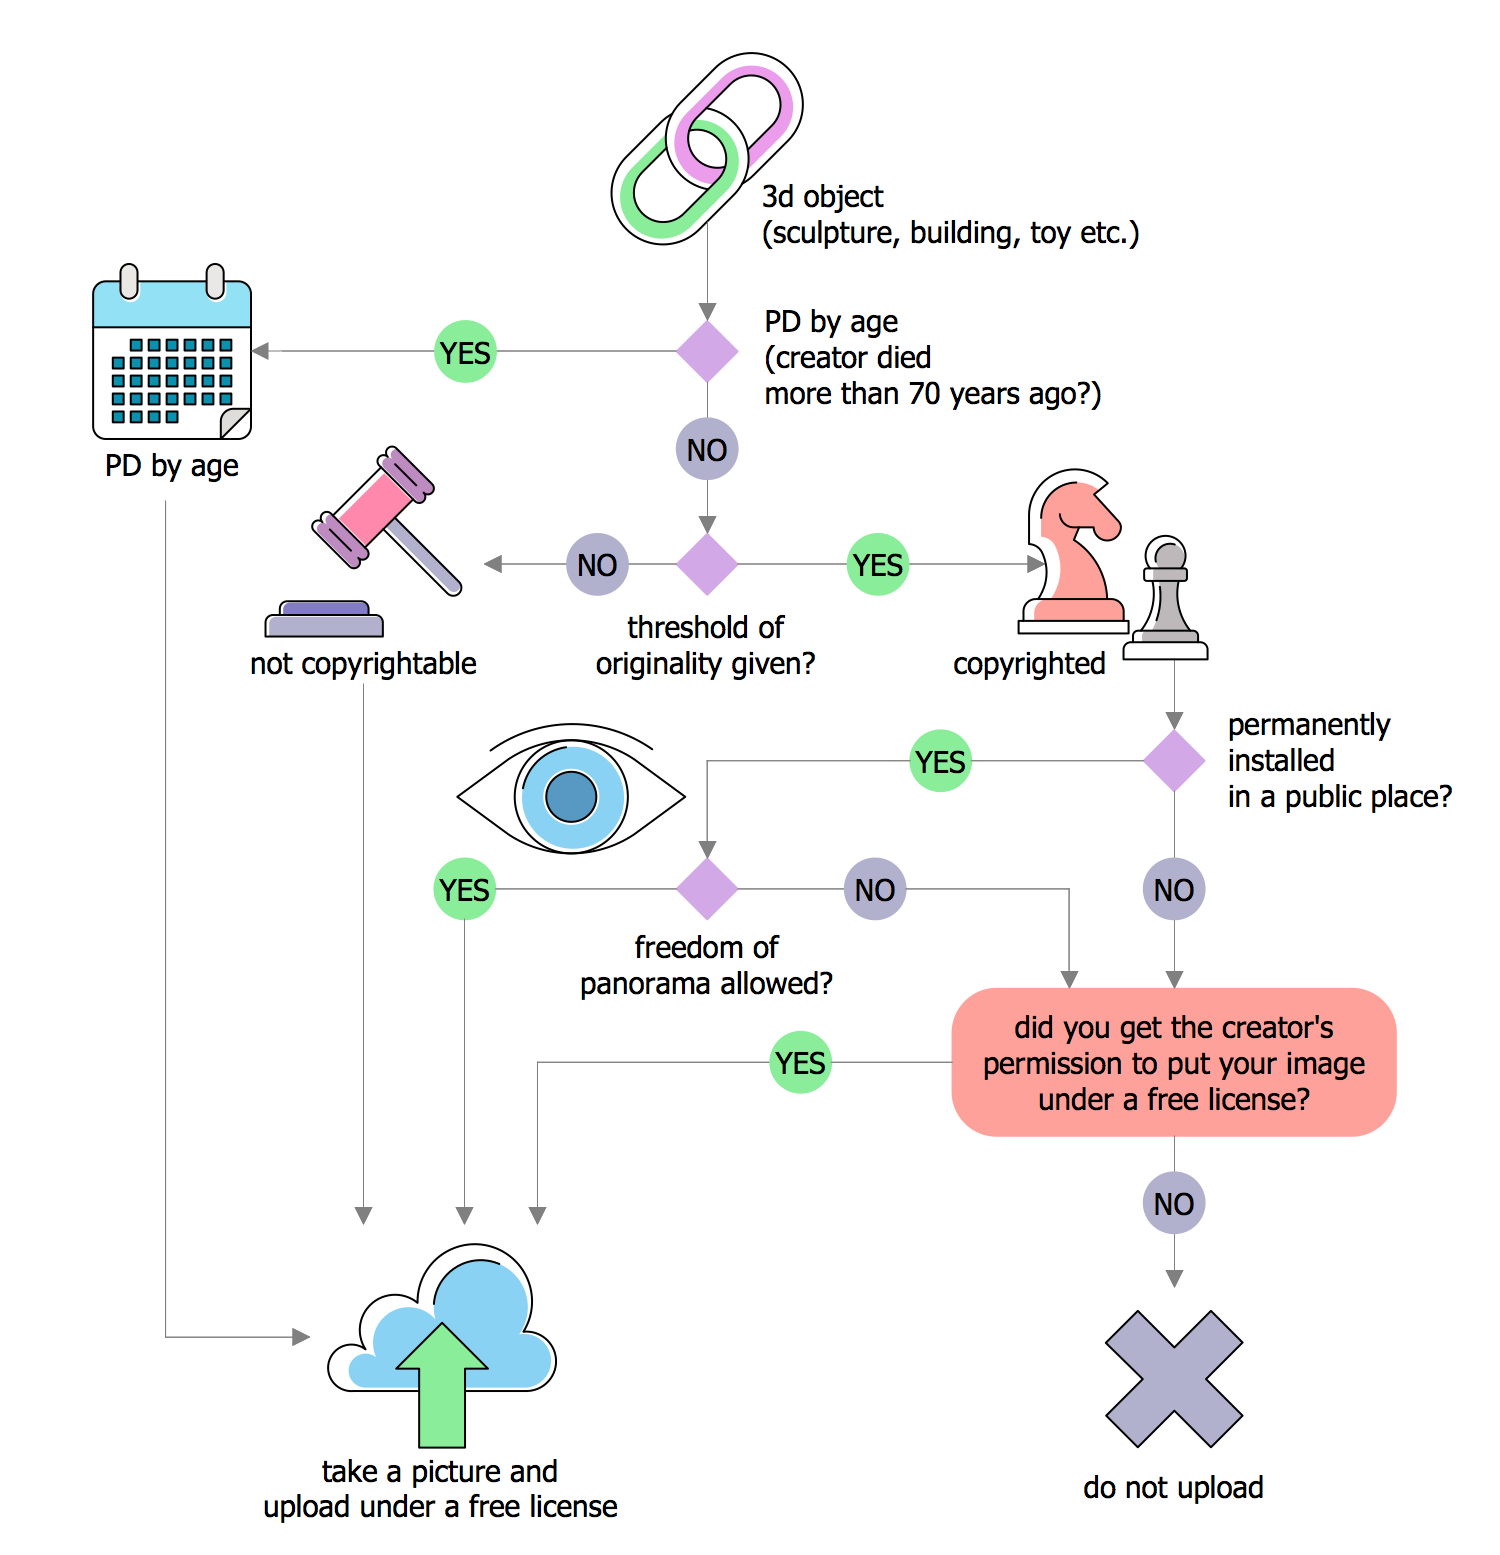
Marketing flowchart
Fault Tree Diagram

HelpDesk
How to Draw a Decision-Making Diagram

Influence Diagram

CORRECTIVE ACTIONS PLANNING. Risk Diagram (PDPC)


Types of Flowcharts


Decision Making Software For Small Business


Decision Tree Analysis
The ConceptDraw DIAGRAM diagramming and drawing software is the one that can help with creating the needed drawing, including a decision tree. Making decision tree analysis, it is always easy to make the needed matrix as there are plenty of pre-made templates to be used.
- Decision Tree Algorithm Flowchart And Sequence Daigram
- Decision tree diagram | Decision Making | Fault Tree Diagram ...
- Fishbone Diagram Vs Decision Tree
- Decision Making | Root Cause Tree Diagram | Process Flowchart ...
- Basic Flowchart Symbols and Meaning | Decision Making Software ...
- Basic Flowchart Symbols and Meaning | Process Flowchart | Use a ...
- Fault Tree Diagram | Marketing Charts | IDEF0 Visio | Decision Tree ...
- Fault Tree Diagram | Process Flowchart | Basic Flowchart Symbols ...
- Decision Tree Flowchart
- Process decision program chart (PDPC) - Personal activity | Process ...