HelpDesk
How to Create a Gantt Chart for Your Project
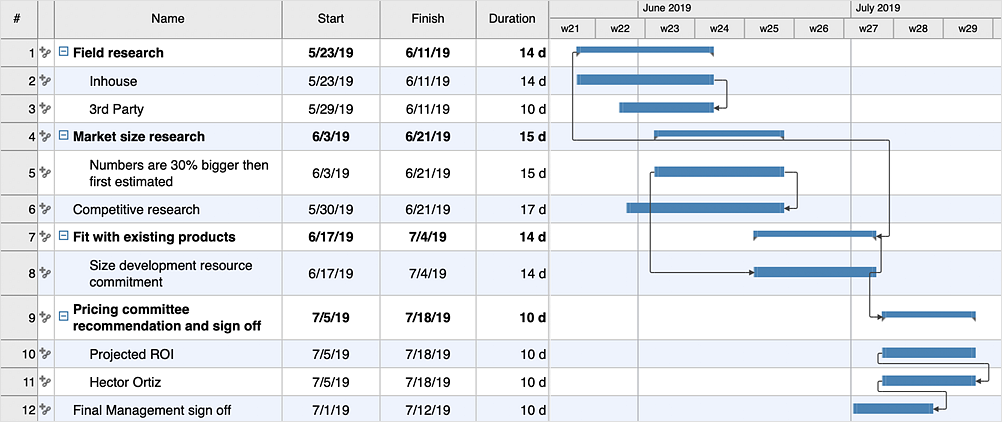
Instruction on how to create Gantt chart using ConceptDraw PROJECT software. Gant Chart is a graphical representation of tasks as segments on a time scale. It helps plan or overlapping.HelpDesk
How to Draw a Gantt Chart
A Gantt chart is intended to provide a visualization of a project schedule. It is developed to help planning, coordinating, and tracking on project tasks implementation. One of the most critical resources for project implementation are time resources. Gantt chart - is one of the most convenient and popular ways of graphical representation of a project tasks progress in conjunction with the corresponding time consumption. Gantt chart's function is to show project tasks completed in progress and to make a project manager sure that project tasks were completed on time. ConceptDraw Office is a clear and easy-to-use tool for project management. It is a very handy visual tool that helps make a project processing clear.HelpDesk
How to Track Your Project Plan vs. the Actual Project Condition
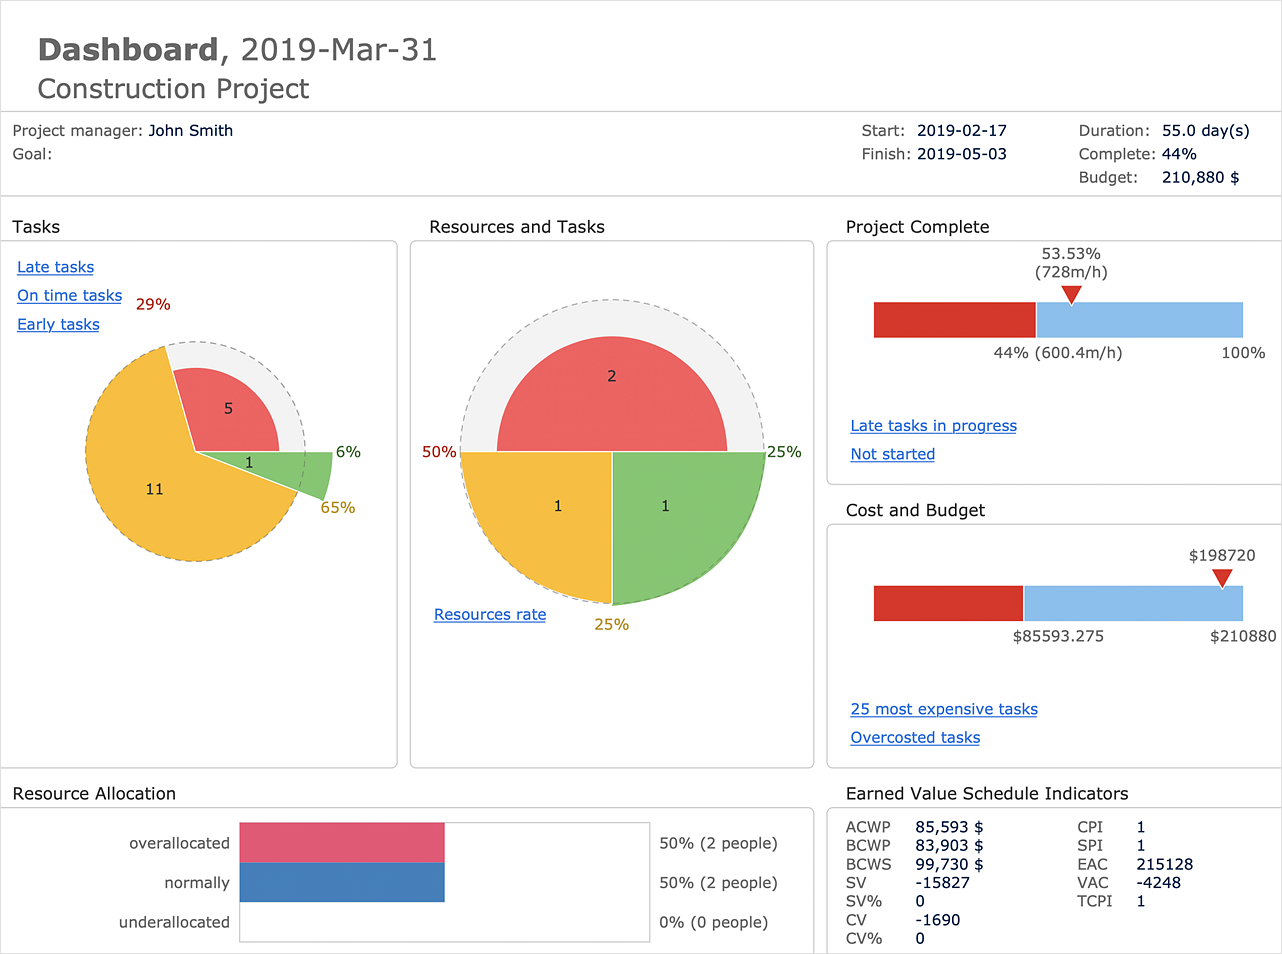
ConceptDraw PROJECT provides a user with the possibility to track how the project is going. Project Manager can compare the actual data with the planned and assess possible measures to resolve issues. ConceptDraw PROJECT has several types of visual reports that can help to assess visually the difference between planned and actual project data.Business diagrams & Org Charts with ConceptDraw DIAGRAM
The business diagrams are in great demand, they describe the business processes, business tasks and activities which are executed to achieve specific organizational and business goals, increase productivity, reduce costs and errors. They let research and better understand the business processes. ConceptDraw DIAGRAM is a powerful professional cross-platform business graphics and business flowcharting tool which contains hundreds of built-in collections of task-specific vector stencils and templates. They will help you to visualize and structure information, create various Business flowcharts, maps and diagrams with minimal efforts, and add them to your documents and presentations to make them successful. Among them are Data flow diagrams, Organization charts, Business process workflow diagrams, Audit flowcharts, Cause and Effect diagrams, IDEF business process diagrams, Cross-functional flowcharts, PERT charts, Timeline diagrams, Calendars, Marketing diagrams, Pyramids, Target diagrams, Venn diagrams, Comparison charts, Analysis charts, Dashboards, and many more. Being a cross-platform application, ConceptDraw DIAGRAM is very secure, handy, free of bloatware and one of the best alternatives to Visio for Mac users.
HelpDesk
How to Create Project Diagrams on PC
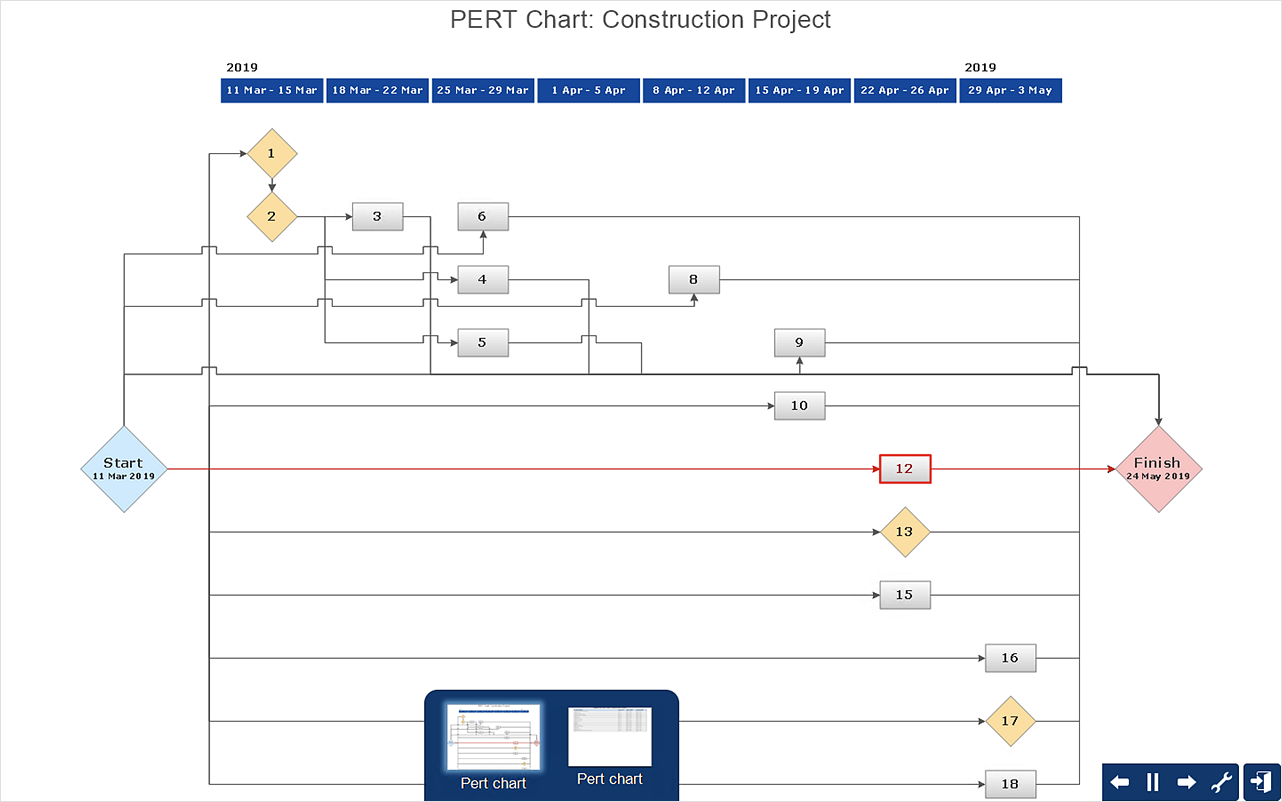
Visual diagrams gives the ability to view at a detailed level project attributes such as project scope, logical connections in the project, critical paths, key events on the timeline, milestones, tasks, calendars for work, and resource utilization.- Difference Between Timeline And Gantt Chart
- Difference Between Gantt Chart And Process Flow Chart
- Difference Between Pert And Gantt Chart
- Difference Between Gantt Chart And Timeline
- The Differences Between Gantt Charts And Timelines
- Difference Between A Gannt Chart And Mind Map
- Difference Between Flow Chart And Pie Chart
- Open Source Gantt Chart Software
- Similarities Between Gantt Chart And Pert
- What Is The Difference Between Flow Chart And Pie Chart
- Difference Between Outline Process Chart And Flow Process Chart
- Construction Project Chart Examples | Gantt chart examples | Gantt ...
- Procedure For Drawing Time Line Chart And Flow Line Chart For
- Process Flowchart | Line Chart Examples | How to Make a Timeline ...
- Difference Between A Flow Chat And A Bubble Diagram
- Differentiate Between Outline Process Chart And Flow Process Chart
- Mindmap Gantt Chart Components
- Difference Between Flowchart And Bubble Diagram
- Sample Of Project Chart Time Line
- Example Of Timeline Chart


