Chart Maker for Presentations
Easy charting software comes with beautiful chart templates and examples. This makes it easy to create professional charts without prior experience.Pie Chart Examples and Templates
A pie chart or a circle graph is a circular chart divided into sectors, illustrating numerical proportion. In a pie chart, the arc length of each sector and consequently its central angle and area, is proportional to the quantity it represents. Pie chart examples and templates created using ConceptDraw PRO software helps you get closer with pie charts and find pie chart examples suite your needs.Basic Diagramming
Perfect charts and graphics diagramming software with rich examples and template. ConceptDraw is ideal to draw Charts and Graphics.
Business Report Pie. Pie Chart Examples
This sample shows the Business Report Pie Chart. The Pie Chart visualizes the data as the proportional parts of a whole, illustrates the numerical proportion. Pie Charts are very useful in the business, statistics, analytics, mass media.Column Chart Template
Column chart templates from ConceptDraw collection can help you find the best visual depiction for you data. You can easily modify column chart templates according to data you want to visualize.Waterfall Bar Chart
Waterfall chart shows the changing of the value from one state to another through the series of intermediate changes. The waterfall diagrams are widely used in the business. They are used to represent the set of figures and allow link the individual values to the whole.Pie Chart Word Template. Pie Chart Examples
The Pie Chart visualizes the data as the proportional parts of a whole and looks like a disk divided into sectors. The pie chart is type of graph, pie chart looks as circle devided into sectors. Pie Charts are widely used in the business, statistics, analytics, mass media. It’s very effective way of displaying relative sizes of parts, the proportion of the whole thing.Pie Donut Chart. Pie Chart Examples
This sample shows the Pie Donut Chart. It was created in ConceptDraw PRO diagramming and vector drawing software using the ready-to-use object from the Pie Charts Solution from Graphs and Charts area of ConceptDraw Solution Park. The Pie Donut Chart visualizes the percentage of parts of the whole and looks like as a ring divided into sectors. Pie Donut Charts are widely used in the business, statistics, analytics, mass media.Chart Examples
Easy charting software comes with beautiful chart templates and examples. This makes it easy to create professional charts without prior experience.Scatter Diagram
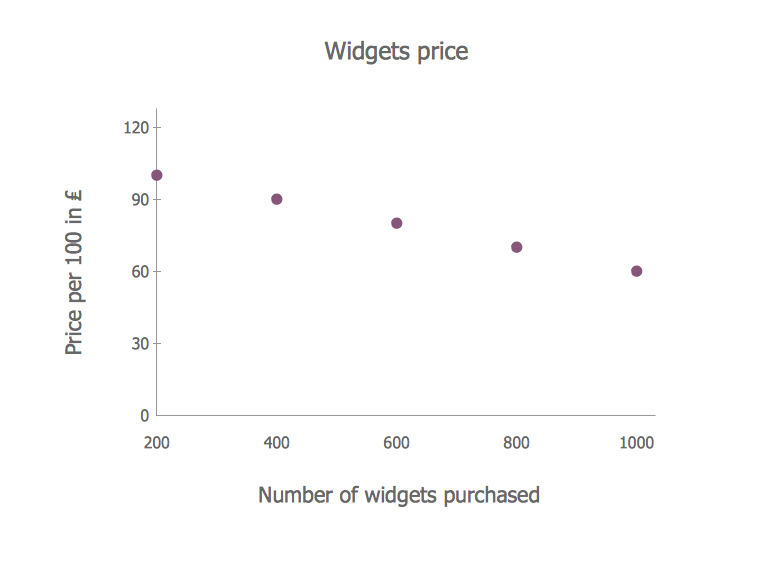
This sample shows the scatter diagram that displays the inverse correlation. The correlation measures the strength of association among two variables. You can see that when the number of widgets increases, the price per 100 widgets decreases. Using the ready-to-use objects from the Line Graphs Solution for ConceptDraw PRO you can create your own professional looking Scatter Charts quick and easy.Pie Chart
ConceptDraw PRO diagramming and vector drawing software offers the Pie Charts solution from the Graphs and Charts area of ConceptDraw Solution Park for quick and easy drawing the Pie Chart of any complexity.Chart Software for Better Presentations
Easy charting software comes with beautiful chart templates and examples. This makes it easy to create professional charts without prior experience. Graphs and Charts Area provide a wide collection of professional looking predesigned templates, samples and ready-to-use vector stencils that will help you to draw the charts and diagrams of various types: Pie Charts, Donut Charts, Line Charts, Column Charts, Bar Charts, Pyramids, Scatter Charts, Venn Diagrams, Spider Charts, Area Charts, Divided Bar Graphs.What Is a Picture Graph?
What is a Picture Graph? It's one of the most useful way which allows explain the information, statistical data in a visual form using the pictures. ConceptDraw PRO extended with Picture Graphs solution from the Graphs and Charts area offers you the easiest way of Picture Graphs drawing.Best Program to Make Diagrams
Make diagrams, charts, workflows, flowcharts, org charts, project charts easily with ConceptDraw software.
- Conversion Of Graphics And Pie Chart Table And Flow Bar Chart
- Composition Conversion Of Graphics Pie Chart Bar Chart Table
- Writing Definitions Composition Conversion Of Graphics Pie Chart
- Composition Conversion Of Graphics Pie Chart Bar Chart Table
- Conversation Graphics Pie Chart Bar Chart Table
- Conversion Of Graphics Pie Chart
- Pie Chart Bar Graph Flow Chart And Table
- Conversion Of Graphics Bar Chart Examle
- Composition Graphics Pie Chart Bar Chart Table Flow Chart
- Conversions Of Graphics Pie Chart
- Charts Pie Flow Bar
- Organizational Chart Templates | Process Flowchart | Pie Chart ...
- Business Report Pie. Pie Chart Examples | Examples of Flowcharts ...
- Pie Chart Bar Chart Flow Chart Define
- Percentage Pie Chart . Pie Chart Examples | Bar Graphs | How to ...
- Percentage Pie Chart . Pie Chart Examples | Composition ...
- Conversion Of Graphics Flow Chart
- Data Flow Diagram | How to Connect a Live Object to a Text Data ...
- Conversition Of Bar Chart Into Pie Chart


