HelpDesk
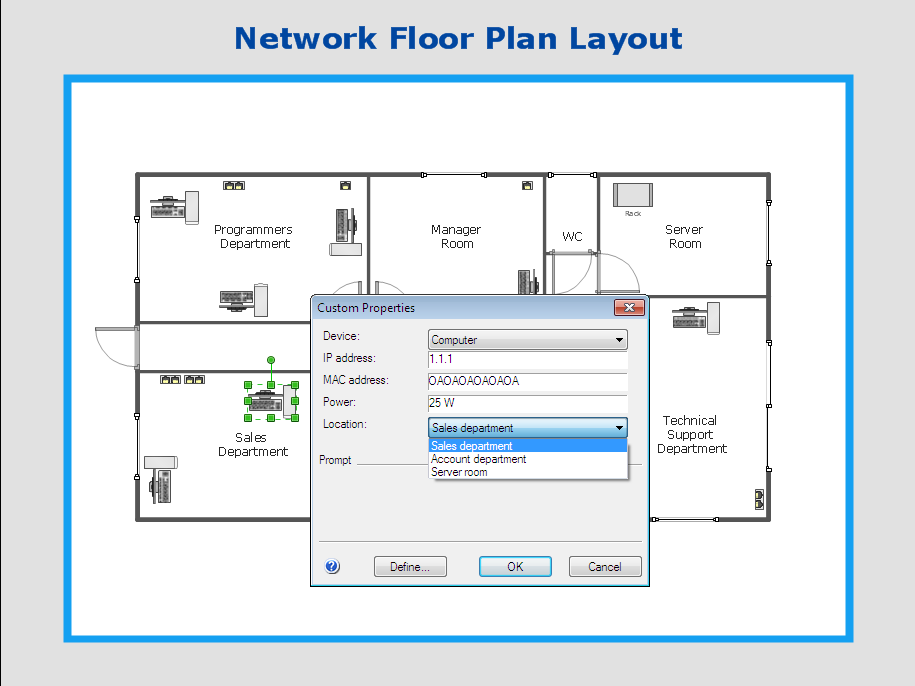
How to Work with Custom Properties in ConceptDraw PRO on PC
ConceptDraw PRO can store additional, user-defined data that can be assigned to a particular shape. This data is stored in the Custom Properties options.
 Business Process Mapping
The Business Process Mapping solution for ConceptDraw PRO is for users involved in process mapping and creating SIPOC diagrams.
HelpDesk
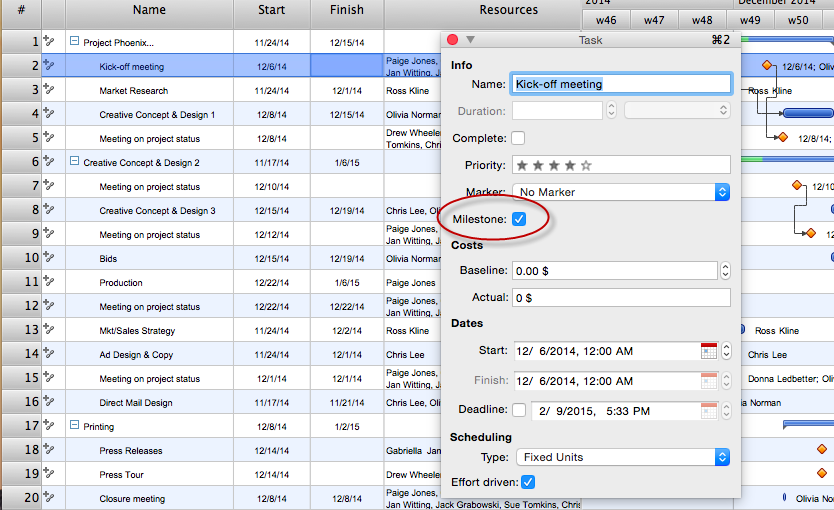
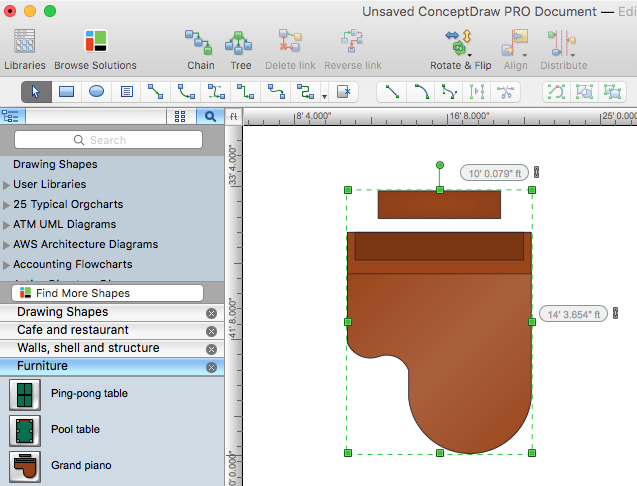
How to Change Measurement Units in ConceptDraw Drawing
ConceptDraw PRO allows you to work with drawings with many different measurement units.HelpDesk
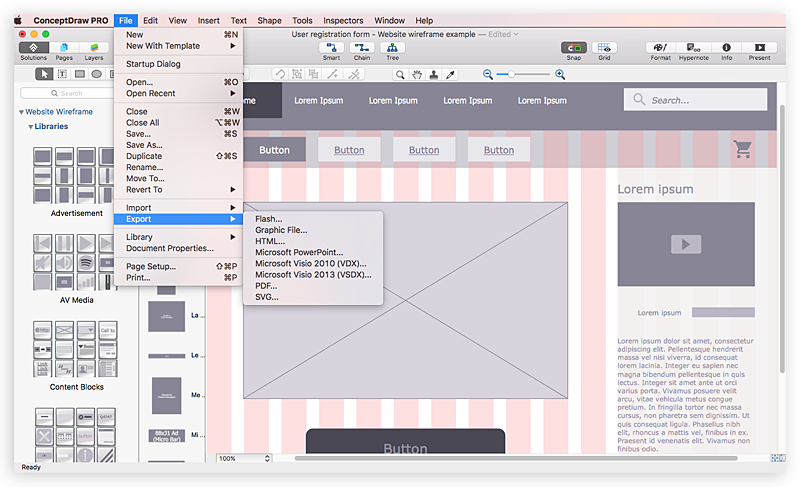
How to Develop Website Wireframes Using ConceptDraw PRO
Website design is a rather complicated process. The development of a website wireframe is an important step in any screen design process. The first step of this process before coding can start, web designer creates a website wireframe — a mock-up for what will be displayed on the screen when navigating through the web site pages. A wireframe design always includes three components:Information design, navigation design and interface design. The configuration of these components depends on the business model of the website. The Website Wireframing tools provided with ConceptDraw Website Wireframe solution helps to define the information hierarchy of website design, making it easier for web-developers to plan the layout according to how a site visitor have to process the information.HelpDesk
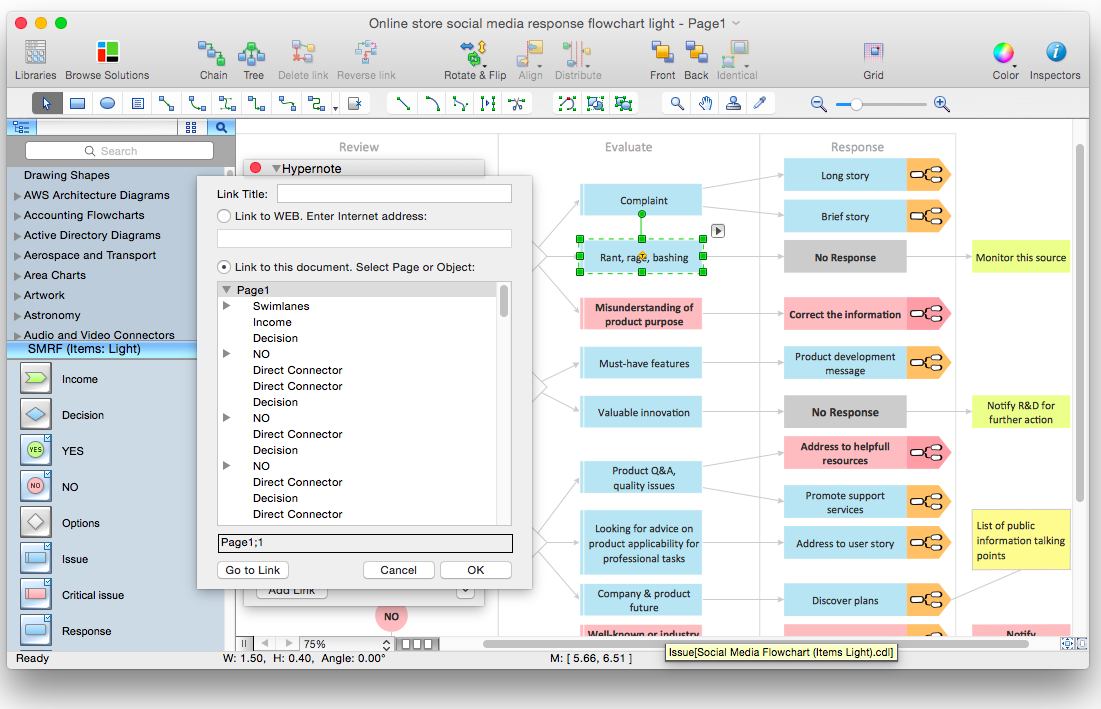
How to Organize a Social Media Activity Using Social Media Response Solution
Tips on how to use flowcharting and mindmapping for social media activity organizing
HelpDesk
How to Draw the Different Types of Pie Charts
Using the Pie Chart, you can visually estimate the relative contribution that different data categories contribute to a whole value. The pie chart displays the statistics in a visual format. The main use of pie charts to show comparisons. The larger piece of the pie, the more the value of this value compared to the rest. Various applications of pie charts can be found in business and education. For business, pie charts can be used to compare the success or failure of the goods or services. They may also be used to display the business market share.- Step chart - Template | Cross-Functional Flowchart | Audit Steps ...
- Total Quality Management with ConceptDraw | Define Man Flow ...
- Metropolitan area networks (MAN). Computer and Network Examples
- Campus Area Networks (CAN). Computer and Network Examples ...
- Network Glossary Definition | Network Topologies | Software ...
- Mobile satellite communication network diagram | Hybrid satellite ...
- Basic Flowchart Symbols and Meaning | Flowchart Definition ...
- Basic Flowchart Symbols and Meaning | Flowchart Definition ...
- Define Flowchart And Draw The Basic Symbol Of Flowchart
- Basic Flowchart Symbols and Meaning | Flowchart Definition ...
- Basic Flowchart Symbols and Meaning | Flowchart Definition | Cross ...
- Flowchart Definition | Basic Flowchart Symbols and Meaning ...
- Network Glossary Definition | Personal area (PAN) networks ...
- Network Glossary Definition | Example Of Block Diagram Of Lan Vs ...
- Basic Flowchart Symbols and Meaning | Process Flowchart ...
- Define Lan Man Wan With Block Diagram
- Wireless Network Topology | Network Diagram Examples | Active ...
- Campus Area Network Definition With Examples
- Flowchart Definition | Process Flowchart | Basic Flowchart Symbols ...
- Define A Tree Network Topology With Diagram
