 Divided Bar Diagrams
The Divided Bar Diagrams Solution extends the capabilities of ConceptDraw DIAGRAM with templates, samples, and a library of vector stencils for drawing high impact and professional Divided Bar Diagrams and Graphs, Bar Diagram Math, and Stacked Graph.

Competitor Analysis

Use this chart template to design your divided bar diagrams.
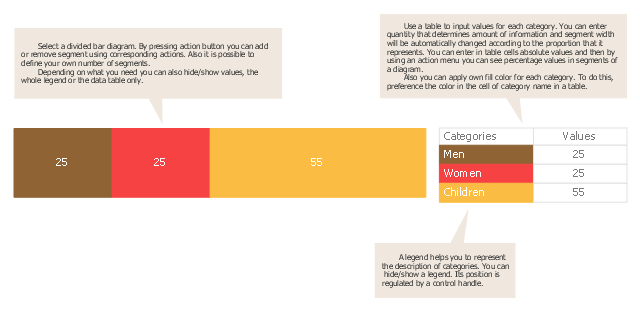
A divided bar chart is a rectangle divided into segments, illustrating numerical proportion. In a divided bar chart, the length of each segment (and consequently its area), is proportional to the quantity it represents.
This divided bar graph displays the number of people per day who visited swimming pool.
The template "Divided bar diagram" for the ConceptDraw PRO diagramming and vector drawing software is included in the Divided Bar Diagrams solution from the Graphs and Charts area of ConceptDraw Solution Park.
Template

This divided bar chart sample shows the petroleum products yielded from 1 barrel of crude oil in California in 2004. It was drawn using data from the chart on the California Energy Almanac website. [energyalmanac.ca.gov/ gasoline/ whats_ in_ barrel_ oil.html]
"Petroleum products are useful materials derived from crude oil (petroleum) as it is processed in oil refineries. Unlike petrochemicals, which are a collection of well-defined usually pure chemical compounds, petroleum products are complex mixtures. The majority of petroleum is converted to petroleum products, which includes several classes of fuels.
According to the composition of the crude oil and depending on the demands of the market, refineries can produce different shares of petroleum products. The largest share of oil products is used as "energy carriers", i.e. various grades of fuel oil and gasoline. These fuels include or can be blended to give gasoline, jet fuel, diesel fuel, heating oil, and heavier fuel oils. Heavier (less volatile) fractions can also be used to produce asphalt, tar, paraffin wax, lubricating and other heavy oils. Refineries also produce other chemicals, some of which are used in chemical processes to produce plastics and other useful materials. Since petroleum often contains a few percent sulfur-containing molecules, elemental sulfur is also often produced as a petroleum product. Carbon, in the form of petroleum coke, and hydrogen may also be produced as petroleum products. The hydrogen produced is often used as an intermediate product for other oil refinery processes such as hydrocracking and hydrodesulfurization." [Petroleum product. Wikipedia]
The chart example "Petroleum products yielded from one barrel of crude oil" was created using the ConceptDraw PRO diagramming and vector drawing software extended with the Divided Bar Diagrams solution from the Graphs and Charts area of ConceptDraw Solution Park.
Divided bar chart

Basic Diagramming


Best Program to Make Diagrams

Best Multi-Platform Diagram Software

Basic Diagramming

- How to Draw a Divided Bar Chart in ConceptDraw PRO | Bar Chart ...
- What Is Divided Bar Chart
- How to Draw a Divided Bar Chart in ConceptDraw PRO | Basic ...
- How to Draw a Divided Bar Chart in ConceptDraw PRO | Bar ...
- How to Draw a Divided Bar Chart in ConceptDraw PRO | Divided ...
- Divided Bar Diagrams | How to Draw a Divided Bar Chart in ...
- What Is Called Divided Rectangle Diagram
- Divided Bar Diagrams | Basic Flowchart Symbols and Meaning ...
- Divided Bar Diagrams | Basic Divided Bar Diagrams | How to Draw a ...
- Electrical Engineering | Bar Graphs | Divided Bar Diagrams | Bar ...