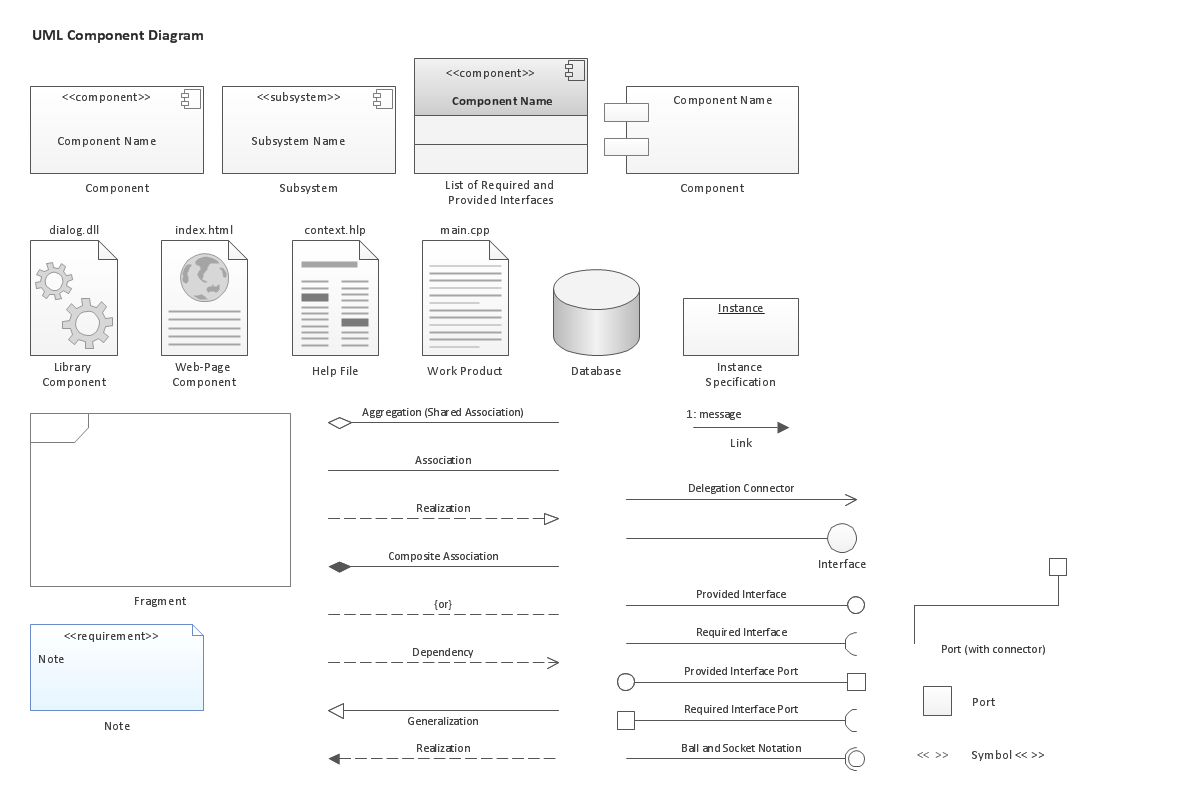
UML Component Diagram. Design Elements

UML Diagram Types List

UML Notation

 Fishbone Diagrams
The Fishbone Diagrams solution extends ConceptDraw DIAGRAM software with the ability to easily draw the Fishbone Diagrams (Ishikawa Diagrams) to clearly see the cause and effect analysis and also problem solving. The vector graphic diagrams produced using this solution can be used in whitepapers, presentations, datasheets, posters, and published technical material.
Easy Flowchart Program and Standard Flowchart Symbols

PROBLEM ANALYSIS. Prioritization Matrix


Software development with ConceptDraw DIAGRAM

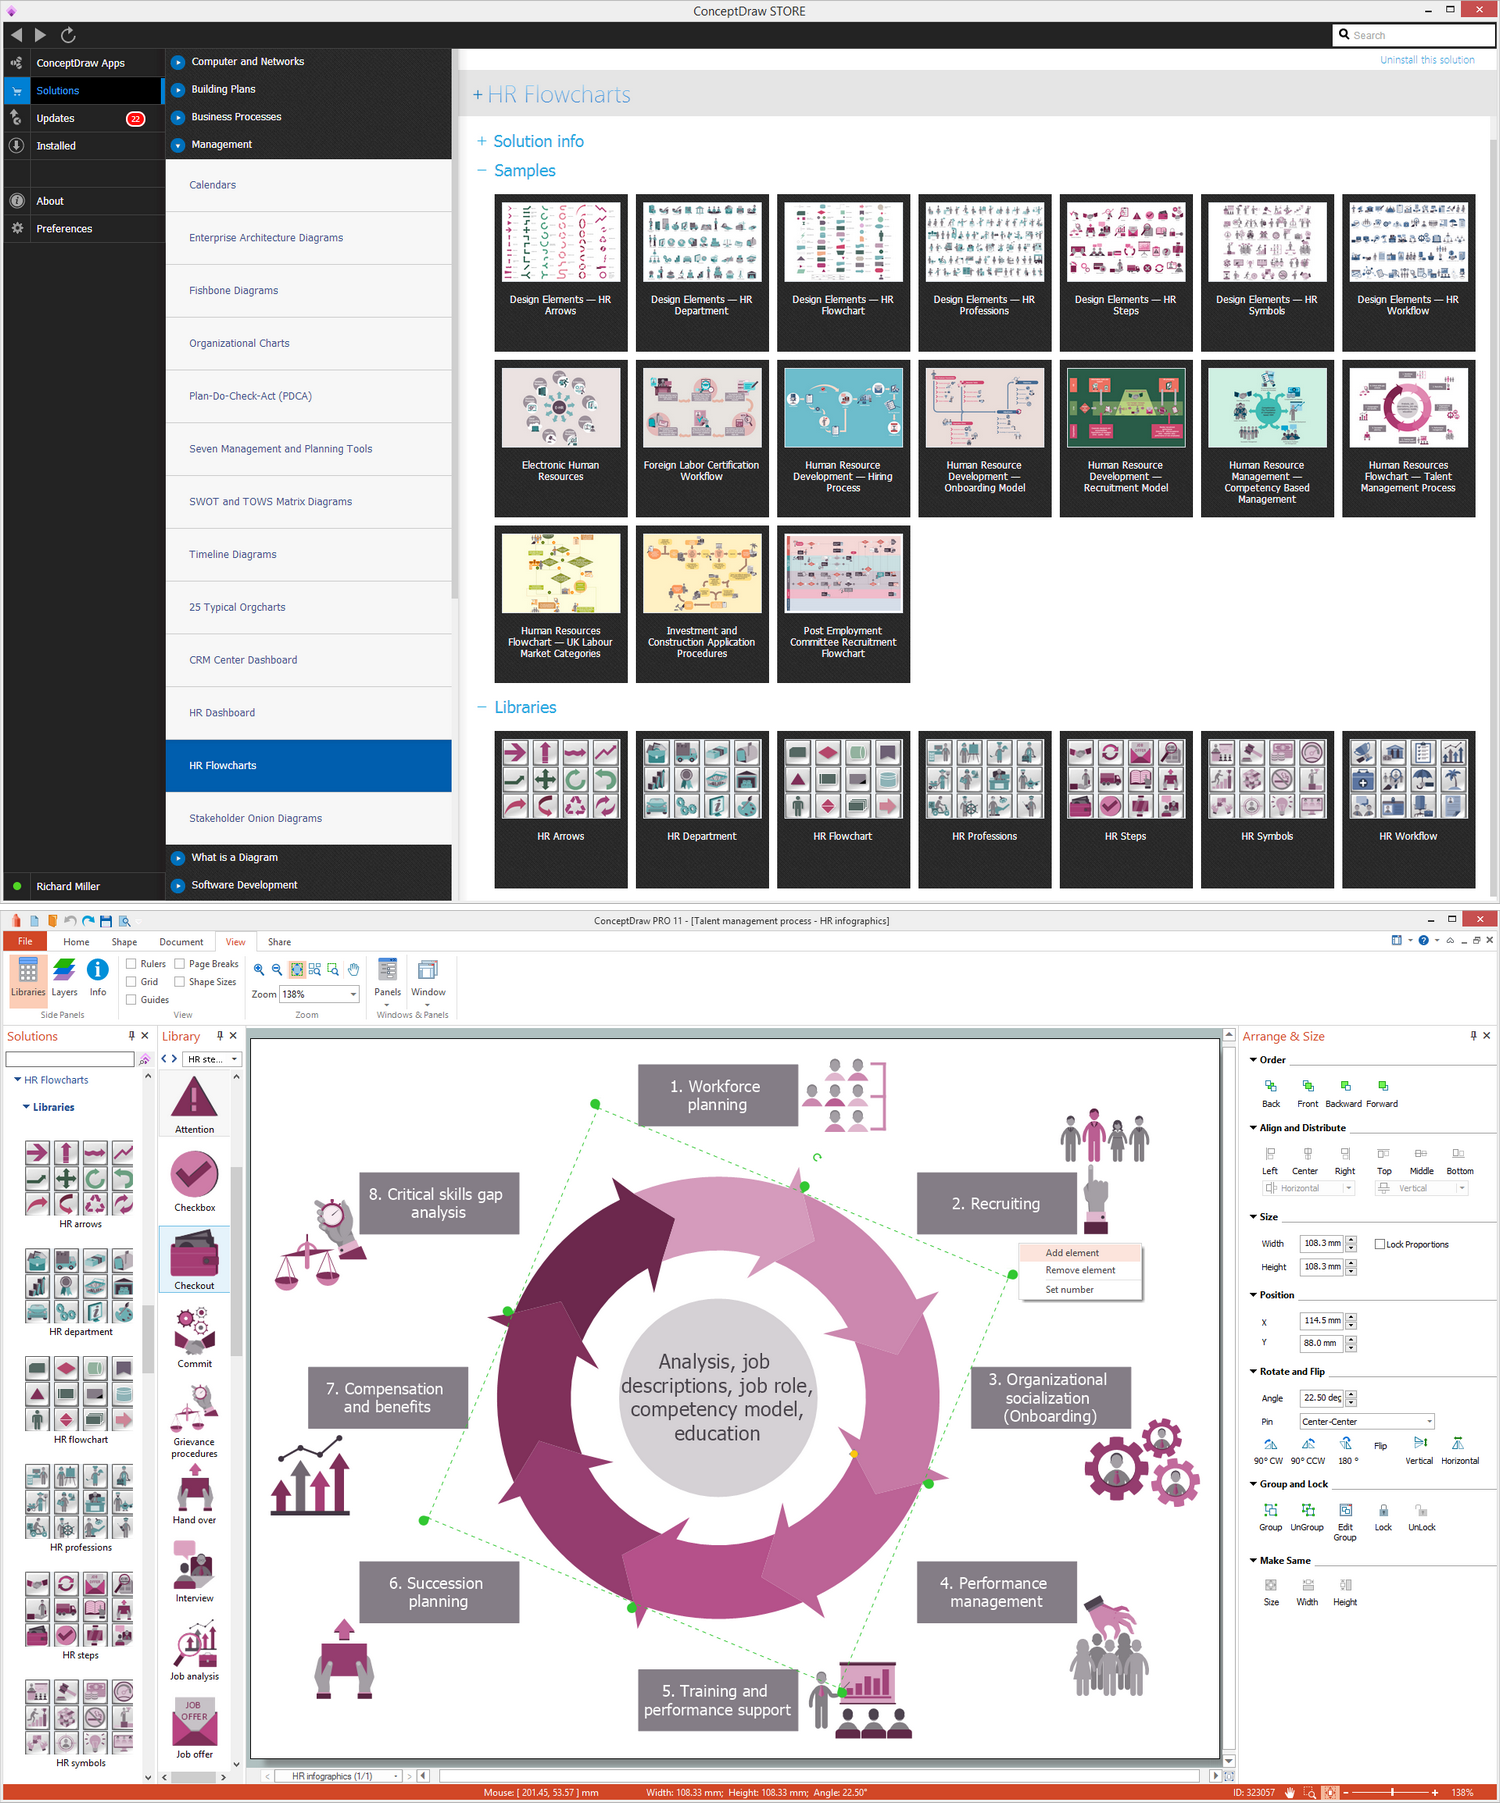
Human Resources
Software Diagram Templates
