IDEF3 Standard
Use Case Diagrams technology. IDEF3 Standard is intended for description and further analysis of technological processes of an enterprise. Using IDEF3 standard it is possible to examine and model scenarios of technological processes.Garrett IA Diagrams with ConceptDraw PRO
Garrett IA diagrams are used at development of Internet-resources, in particulars at projecting of interactions of web-resource elements. The diagram of information architecture of the web resource which is constructed correctly with necessary details presents to developers the resource in comprehensible and visual way.HelpDesk
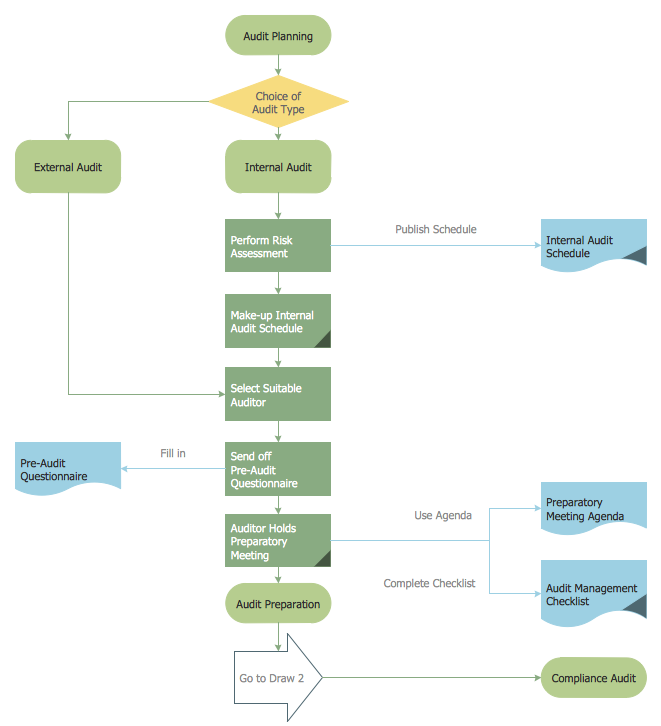
How to Create an Audit Flowchart Using ConceptDraw PRO
Audit flowcharts are often used in auditors activity. This is the most effective way of preparation and documentation of the audit process. Financial audit process has a clear structure, and therefore audit flowchart is often used to denote an audit process. This is the most effective way of preparation and documentation of the audit process. Flowcharts are often used in auditors activity. A flowchart may be created at any stage of an audit process as an aid in the determination and evaluation of a client's accounting system. ConceptDraw PRO allows you to create professional accounting flowchart quickly using the professional Audit Flowcharts solution.Data structure diagram with ConceptDraw PRO
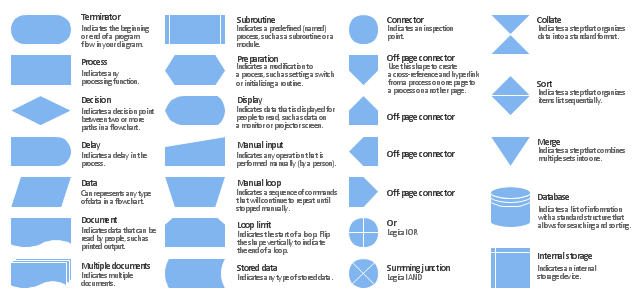
Data structure diagram (DSD) is intended for description of conceptual models of data (concepts and connections between them) in the graphic format for more obviousness. Data structure diagram includes entities description, connections between them and obligatory conditions and requirements which connect them. Create Data structure diagram with ConceptDraw PRO.The vector stencils library "Flowchart" contains 26 symbols for drawing the flow charts using the ConceptDraw PRO diagramming and vector drawing software.
"Flowcharts are used in designing and documenting complex processes or programs. Like other types of diagrams, they help visualize what is going on and thereby help the viewer to understand a process, and perhaps also find flaws, bottlenecks, and other less-obvious features within it. There are many different types of flowcharts, and each type has its own repertoire of boxes and notational conventions. The two most common types of boxes in a flowchart are:
(1) a processing step, usually called activity, and denoted as a rectangular box;
(2) a decision, usually denoted as a diamond.
A flowchart is described as "cross-functional" when the page is divided into different swimlanes describing the control of different organizational units. A symbol appearing in a particular "lane" is within the control of that organizational unit. This technique allows the author to locate the responsibility for performing an action or making a decision correctly, showing the responsibility of each organizational unit for different parts of a single process. ...
Common alternate names include: flowchart, process flowchart, functional flowchart, process map, process chart, functional process chart, business process model, process model, process flow diagram, work flow diagram, business flow diagram. The terms "flowchart" and "flow chart" are used interchangeably." [Flowchart. Wikipedia]
The example "Design elements - Flowchart" is included in the Flowcharts solution from the area "What is a Diagram" of ConceptDraw Solution Park.
- Which Symbol Is Used To Denote Flow Lines In A Flow Chart
- Rules In Flow Line Map
- Process Flowchart | Basic Flowchart Symbols and Meaning | Flow ...
- Process Flowchart | Basic Flowchart Symbols and Meaning ...
- Flow Lines
- Process Flowchart | Basic Flowchart Symbols and Meaning | Flow ...
- Entity Relationship Diagram Symbols | ERD Symbols and Meanings ...
- Basic Flowchart Symbols and Meaning | Audit Flowchart Symbols ...
- HR Flowchart Symbols | Basic Flowchart Symbols and Meaning ...
- Basic Flowchart Symbols and Meaning | Process Flowchart | Data ...
- Basic Flowchart Symbols and Meaning | Business Process ...
- Use Of Terminal Processing And Flow Lines
- What Is The Use Of Terminal Processing And Flow Lines
- Basic Flowchart Symbols and Meaning | Entity Relationship ...
- Basic Flowchart Symbols and Meaning | Design elements - HR ...
- Basic Flowchart Symbols and Meaning | Design elements - Sales ...
- Basic Flowchart Symbols and Meaning | Design elements ...
- Basic Flowchart Symbols and Meaning | Flowchart Definition | Types ...
- Basic Flowchart Symbols and Meaning | Process Flowchart | Cross ...


