This site uses cookies. By continuing to browse the ConceptDraw site you are agreeing to our Use of Site Cookies.

UML Deployment Diagram Example - ATM System UML diagrams

The UML Deployment Diagram is used for visualization of elements and components of a program, that exist at the stage of its execution. It contains graphical representations of processors, devices, processes, and relationships between them. The UML Deployment Diagram allows to determine the distribution of system components on its physical nodes, to show the physical connections between all system nodes at the stage of realization, to identify the system bottlenecks and reconfigure its topology to achieve the required performance. The UML Deployment diagram is typically developed jointly by systems analysts, network engineers and system engineers. ConceptDraw DIAGRAM diagramming and vector drawing software with Rapid UML solution from Software Development area of ConceptDraw Solution Park perfectly suits for designing different types of UML diagrams, including the UML Deployment Diagrams. There are included a lot of design elements, templates, examples and samples, among them an example of work of ATM (Automated Teller Machine) banking system.

Interaction Overview Diagram

UML Interaction Overview Diagram schematically shows a control flow with nodes and a sequence of activities that can contain interaction or sequence diagrams.

UML Class Diagram Example - Buildings and Rooms

This sample was created in ConceptDraw DIAGRAM diagramming and vector drawing software using the UML Class Diagram library of the Rapid UML Solution from the Software Development area of ConceptDraw Solution Park. This sample shows the structure of the building and can be used by building companies, real estate agencies, at the buying / selling of the realty.

Structured Systems Analysis and Design Method (SSADM) with ConceptDraw DIAGRAM

Structured Systems Analysis and Design Method (abbr. SSADM) is a method developed in Great Britain and accepted in 1993 as a national standard for information systems development and analysis. SSADM is based on Data Flow Diagrams and is characterized with presence of clear sequence of steps at projecting, analysis, and documenting of information system. It involves 6 main stages: analysis of existing system or estimation of practicability, requirements definition, determination of technical requirements and equipment cost, development of logical data model, projecting of logical requirements and specification them, physical projecting. Each of them is also divided into several steps defining the tasks that should be fulfilled at a given stage. The most important SSADM elements are flows modeling with help of DFD, data logic modeling with help of LDS (Logical Data Structure) and description of entities behavior. Applying of SSADM is easy with ConceptDraw DIAGRAM diagramming and vector drawing software and Data Flow Diagram solution.

UML Business Process

UML diagrams of business processes. The Rapid UML solution provides diagram examples, templates and vector stencils libraries for quick and easy drawing all types of UML 2.x and 1.x diagrams: UML activity diagrams, UML communication (collaboration) diagrams, UML component diagrams, UML composite structure diagrams, UML deployment diagrams, UML interaction overview diagrams, UML object diagrams, UML package diagrams, UML sequence diagrams, UML state machine diagrams, UML timing diagrams, UML use case diagrams.

Flowchart on Bank. Flowchart Examples

This sample was created in ConceptDraw DIAGRAM diagramming and vector drawing software using the Flowcharts solution from the Diagrams area of ConceptDraw Solution Park. This sample shows the Flowchart of the Subprime Mortgage Crisis. This Flowchart describes the decline in housing prices when the housing bubble burst and what it caused on the housing and financial markets. You can also see the Government and Industry responses in this crisis situation.
Create Flowchart on Bank

Competitor Analysis

Competitor analysis is a first and obligatory step in elaboration the proper corporate marketing strategy and creating sustainable competitive advantage. Use powerful opportunities of numerous solutions from ConceptDraw Solution Park for designing illustrative diagrams, charts, matrices which are necessary for effective competitor analysis.

How to Draw an Organization Chart

An Organizational chart is a type of diagram which visually displays the structure of an organization, relationships and relative ranks of the organization′s parts and positions. Organizational chart is constructed as an hierarchical structure, in the form of tree. How to Draw an Organization Chart the most easy and quickly? The Organizational Charts solution, innovative Tree Auto-connection mode and ConceptDraw Arrows10 Technology included in ConceptDraw DIAGRAM software are powerful drawing tools that change the way of diagrams production. Arrows10 Technology provides smart behavior for the connectors, and so quick and precise placement when drawing, and lets easy make the changes and automatic rearrangement. It helps to make the process of drawing diagrams more efficient, easier and faster. Now, you don′t need to think on how to connect or place the objects, you can concentrate fully on what to draw. See obligatory the helpful video tutorial about creation the Organization Charts and orgchart professional presentations with ConceptDraw products.

Campus Area Networks (CAN). Computer and Network Examples

Campus Area Network (CAN) is a computer network which provides wireless access to the Internet or LAN for the users located in two or more buildings on the limited geographical area, or in the open space surrounding these buildings. Campus Area Network is usually set in campus of a university or college, but the same kind of planning and design can be applied for other purposes, for enterprises, office buildings, military bases, industrial complexes, public places like supermarkets, entertainment centers, etc. Another form of temporary CAN can exist during some special events such as rallies, music festivals. The elementary Campus Area Network can also arise spontaneously, due to the distance of spread the radio signals from the access points that are not limited by buildings walls. It is also sensible to have additional access points for the larger and more complex CANs, located at specially places chosen for serving clients. Design easy diagrams and schemes for the Campus Area Networks with Computer Network Diagrams solution for ConceptDraw DIAGRAM.

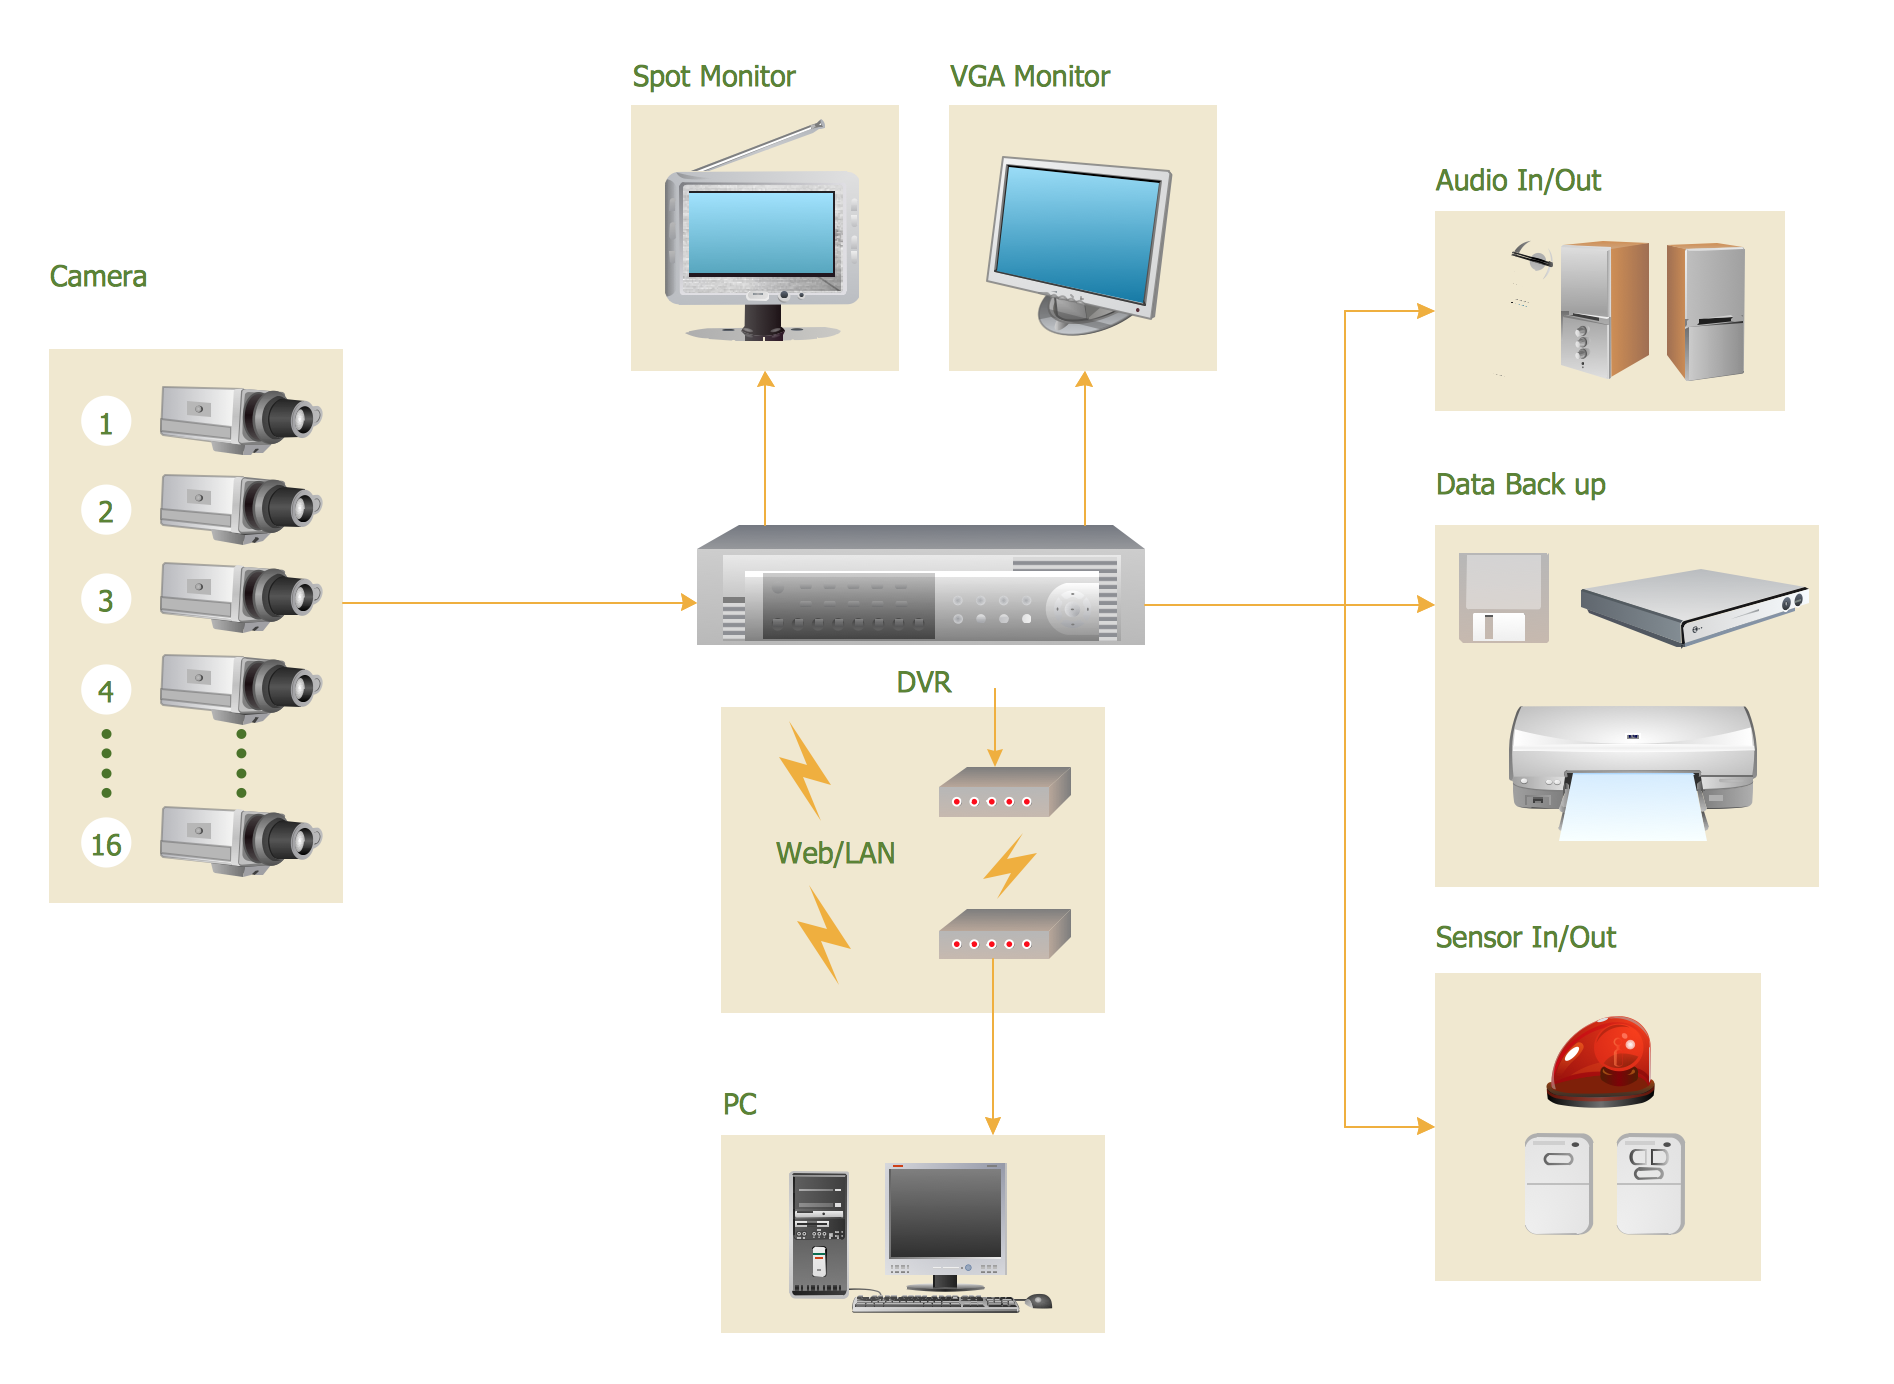
CCTV Surveillance System Diagram. CCTV Network Diagram Example

Creating CCTV system diagrams is quick and easy with ConceptDraw DIAGRAM diagramming software enhanced with Audio, Video, Media solution from ConceptDraw Solution Park. It contains library of vector cliparts of video and TV devices and different digital gadgets for drawing this kind of diagrams.