ConceptDraw DIAGRAM ER Diagram Tool

ConceptDraw DIAGRAM ER Diagram Tool
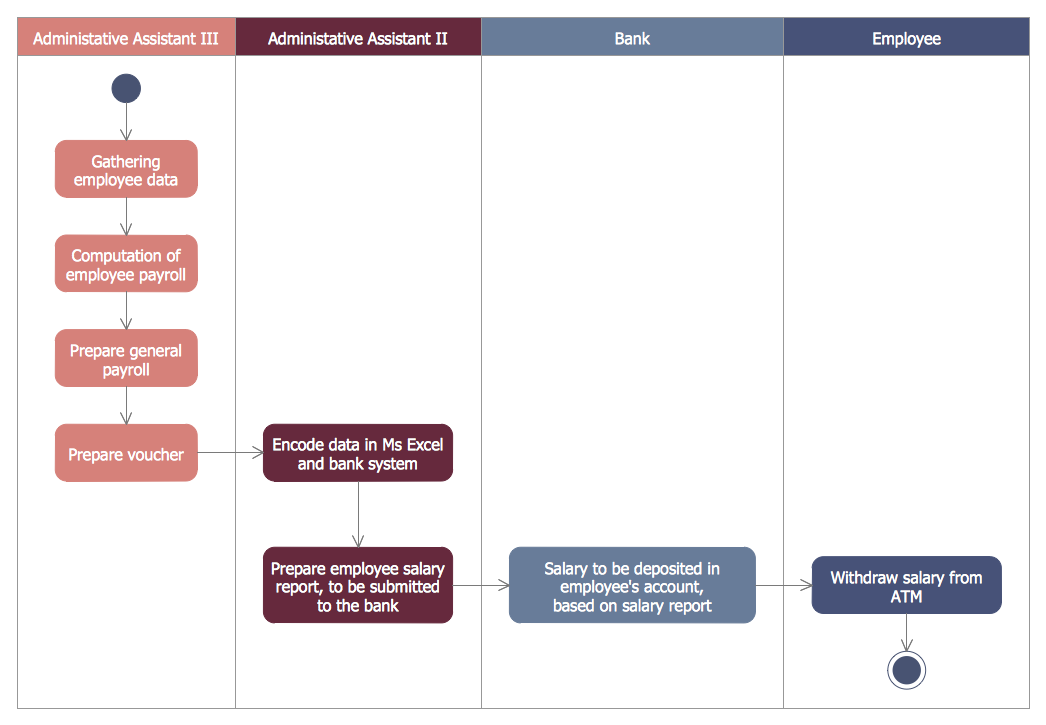
Diagramming Software for Design UML Activity Diagrams


Diagramming Software for Design UML Use Case Diagrams

Bank UML Diagram
Use Case Diagrams technology with ConceptDraw DIAGRAM

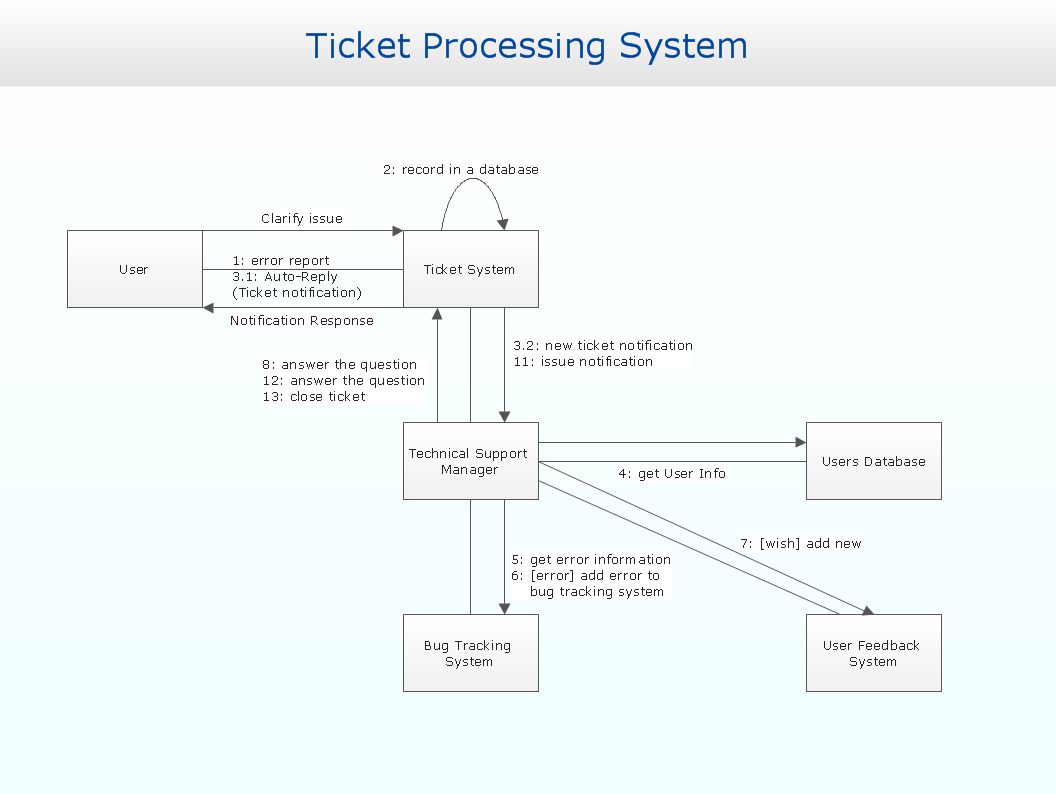
Communication Diagram UML2.0 / Collaboration UML1.x
How to Connect Social Media DFD Flowchart with Action Maps

ConceptDraw DIAGRAM

Introductory Guide to Rapid UML Solution
- UML activity diagram - Deposit slip processing | Vector stencils ...
- Bubble diagrams in Landscape Design with ConceptDraw PRO ...
- UML activity diagram - Deposit slip processing | UML activity ...
- DFD - Process of account receivable | Class UML Diagram for Bank ...
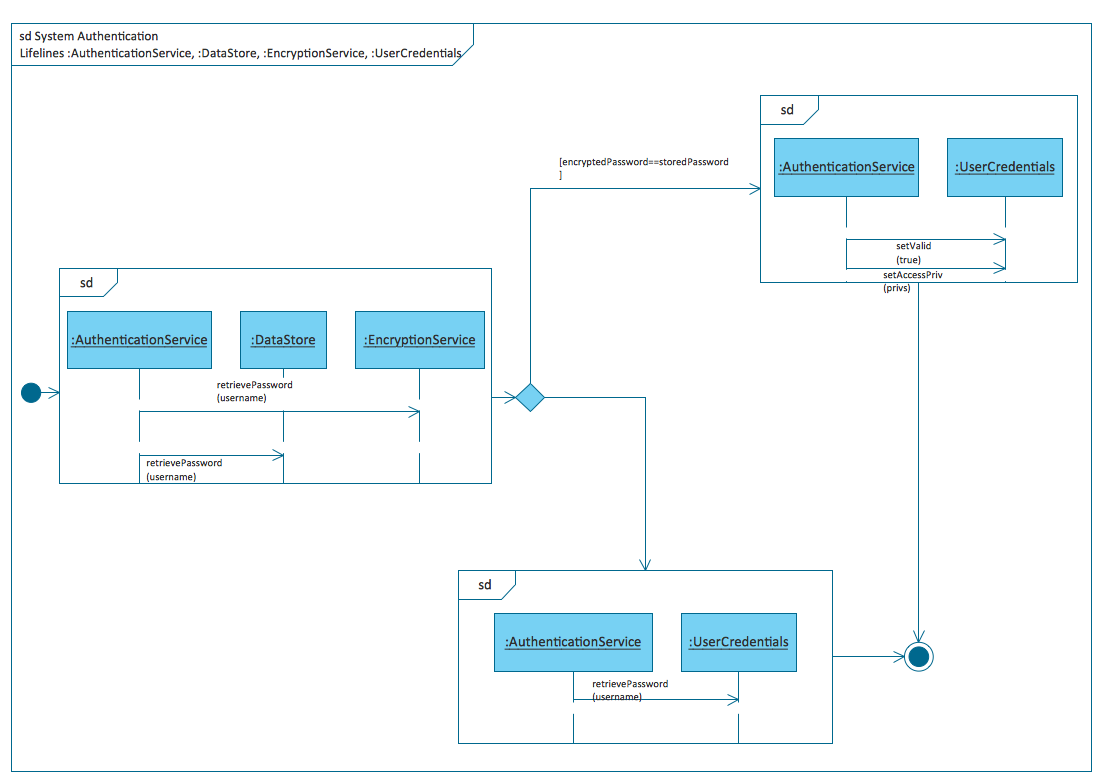
- Atm Deposit System Sequence Diagram
- Rapid UML | Entity-Relationship Diagram ( ERD ) | Event-driven ...
- Bank Sequence Diagram | UML activity diagram - Cash withdrawal ...
- Bank Activity Diagram
- UML use case diagram - Banking system | Entity-Relationship ...
- Entity-Relationship Diagram ( ERD ) | Computer Network Diagrams ...