This site uses cookies. By continuing to browse the ConceptDraw site you are agreeing to our Use of Site Cookies.

Process Flowchart

The main reason of using Process Flowchart or PFD is to show relations between major parts of the system. Process Flowcharts are used in process engineering and chemical industry where there is a requirement of depicting relationships between major components only and not include minor parts. Process Flowcharts for single unit or multiple units differ in their structure and implementation. ConceptDraw PRO is Professional business process mapping software for making Process flowcharts, Process flow diagram, Workflow diagram, flowcharts and technical illustrations for business documents and also comprehensive visio for mac application. Easier define and document basic work and data flows, financial, production and quality management processes to increase efficiency of your business with ConcepDraw PRO. Business process mapping software with Flowchart Maker ConceptDraw PRO includes extensive drawing tools, rich examples and templates, process flowchart symbols and shape libraries, smart connectors that allow you create the flowcharts of complex processes, process flow diagrams, procedures and information exchange. Process Flowchart Solution is project management workflow tools which is part ConceptDraw Project marketing project management software. Drawing charts, diagrams, and network layouts has long been the monopoly of Microsoft Visio, making Mac users to struggle when needing such visio alternative like visio for mac, it requires only to view features, make a minor edit to, or print a diagram or chart. Thankfully to MS Visio alternative like ConceptDraw PRO software, this is cross-platform charting and business process management tool, now visio alternative for making sort of visio diagram is not a problem anymore however many people still name it business process visio tools.
How To Create a Process Flow Chart (business process modelling techniques)

Basic Flowchart Symbols and Meaning

Flowcharts are the best for visually representation the business processes and the flow of a custom-order process through various departments within an organization. ConceptDraw PRO diagramming and vector drawing software extended with Flowcharts solution offers the full set of predesigned basic flowchart symbols which are gathered at two libraries: Flowchart and Flowcharts Rapid Draw. Among them are: process, terminator, decision, data, document, display, manual loop, and many other specific symbols. The meaning for each symbol offered by ConceptDraw gives the presentation about their proposed use in professional Flowcharts for business and technical processes, software algorithms, well-developed structures of web sites, Workflow diagrams, Process flow diagram and correlation in developing on-line instructional projects or business process system. Use of ready flow chart symbols in diagrams is incredibly useful - you need simply drag desired from the libraries to your document and arrange them in required order. There are a few serious alternatives to Visio for Mac, one of them is ConceptDraw PRO. It is one of the main contender with the most similar features and capabilities.
How to Build a Flowchart

Diagram Flow Chart

ConceptDraw PRO is a software for producing flow charts.
"In mathematics and computer science, an algorithm ... is a step-by-step procedure for calculations. Algorithms are used for calculation, data processing, and automated reasoning.
An algorithm is an effective method expressed as a finite list of well-defined instructions for calculating a function. Starting from an initial state and initial input (perhaps empty), the instructions describe a computation that, when executed, proceeds through a finite number of well-defined successive states, eventually producing "output" and terminating at a final ending state. The transition from one state to the next is not necessarily deterministic; some algorithms, known as randomized algorithms, incorporate random input." [Algorithm. Wikipedia]
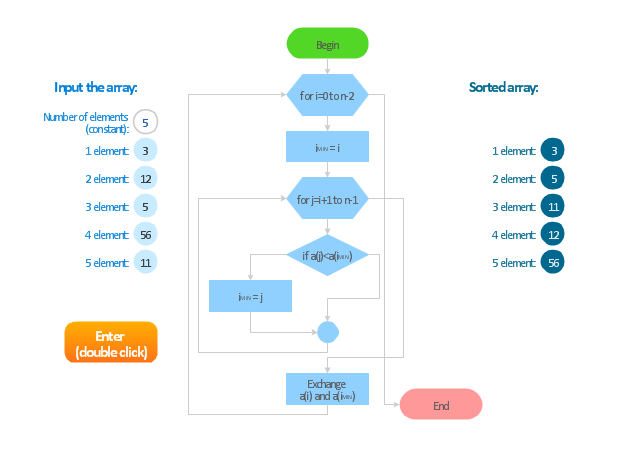
The algorithm flow chart example "Selection sorting method" was created using the ConceptDraw PRO diagramming and vector drawing software extended with the Flowcharts solution from the area "What is a Diagram" of ConceptDraw Solution Park.
Flowchart - Selection sorting method
Flowchart - Selection sorting method, terminator, process, preparation, off-page reference, circle, decision,

flow chart software, flowchart maker, flowchart, flow chart Flowcharts

flow chart software, flowchart maker, flowchart, flow chart
The Flowcharts solution for ConceptDraw PRO is a comprehensive set of examples and samples in several varied color themes for professionals that need to represent graphically a process. Solution value is added by the basic flow chart template and shapes' libraries of flowchart notation. ConceptDraw PRO flow chart creator lets one depict the processes of any complexity and length, as well as design the Flowchart either vertically or horizontally.

Business Process Flowchart Symbols

Business process modeling is known in the corporate world as an excellent tool which can speak. Business process flowcharts, diagrams and maps are used to define the business processes in terms of inputs and outputs, to visually represent and effectively explain complex business processes of an enterprise, and also showcase decisions on a single piece of paper. The process of business process mapping supposes the use of special business process flowchart symbols predefined by Business Process Modeling Notation (BPMN) and taking their roots from the data processing diagrams and programming flow charts. In other words the BPMN standard notation is a common language used for business process design and implementation, that guarantees a clarity of designed Business Process Flowcharts for all business analysts, technical developers and business managers. The ability to create professionally-looking Business Process flowcharts, maps and diagrams, is provided by powerful ConceptDraw PRO software and the Business Process Mapping solution included to ConceptDraw Solution Park.

Technical Flow Chart Example

What illustrates a technical flow chart? Technical flow chart is a diagrammatic representation which visually illustrates the sequence of operations that must to be performed to get the problem's solution. ConceptDraw PRO enhanced with Flowcharts Solution from the "Diagrams" Area of ConceptDraw Solution is a perfect software for drawing Technical Flow Chart Example illustrating the essence and importance of the technical flow chart use.

Flowchart Symbols Accounting. Activity-based costing (ABC) flowchart

The Accounting Flowcharts are helpful and popular kind of flowcharts in a field of business, finance and accounting. The ConceptDraw PRO diagramming software enhanced with Accounting Flowcharts solution from the Finance and Accounting area of ConceptDraw Solution Park is extremely comfortable for visually explaining the accounting processes and for designing Accounting Flowcharts and Accounting Process Flow Diagrams of any complexity. The library of vector design elements included to Accounting Flowcharts solution provides you with major accounting flowchart symbols, which make the drawing process incredibly easy and convenient. The use of them for designing of such sort of Accounting Flowcharts as the Activity-based costing (ABC) flowcharts will simplify the drawing process and will allow to make these flowcharts in a few minutes in ConceptDraw PRO. Design easily your own ABC flowcharts to demonstrate in details the relations and logics of activity-based distribution the costs between the company's units and departments.

Flowchart Components

The ConceptDraw Flowchart component includes a set of samples and templates. This geathered as flowchart maker toolbox which focused on drawing flowcharts of any industry standards.

Material Requisition Flowchart. Flowchart Examples

Material requisition is a request generated by internal or external organization with a goal to inform the purchase department about the needed items and materials. The requisition can be represented as a written document on a pre-printed form or online request in form of electronic document. The electronic inquisition occupies a leading position in a modern world, now the paper forms are replaced by electronic ordering processes and workflows. The requisition is actively used in business as an internal document for notification the store about the needed goods, in medicine for making the orders on medical equipment and medicaments, in industry for creation request for purchasing some items and materials, and so on. ConceptDraw PRO vector graphics software extended with Flowcharts solution from the Diagrams area is powerful and useful tool for drawing various types of Flowcharts, including without doubt the Material Requisition Flowchart of any degree of detailing. Succeed in drawing using the large quantity of predesigned flowchart specific shapes, symbols and icons.

How to Create Flowcharts for an Accounting Information System

Accounting information is a system of interrelated processes which represent financial and accounting data, required for decision making. For representing the accounting processes in a visual and easy for perception form are constructed Accounting Flowcharts. For their creation are used special flowchart symbols, this makes Accounting flowcharts understandable for all users of accounting information system and helps them easy understand the sequence of steps involved to accounting processes. But how to create Flowcharts for an Accounting Information System fast and easy? Use of special design software is useful for this. ConceptDraw PRO software extended with Accounting Flowcharts solution is the best for creation accurate Accounting Flowcharts, for documentation and visually communication on how accounting processes work, how each operation is done. Accounting Flowcharts solution is supplied with library of predesigned commonly used vector symbols, Accounting Flowchart templates and samples demonstrating receiving, purchasing, payment, and other accounting processes.

sales process map, sales process flowchart, sales steps, sales process management Sales Flowcharts

sales process map, sales process flowchart, sales steps, sales process management
The Sales Flowcharts solution lets you create and display sales process maps, sales process workflows, sales steps, the sales process, and anything else involving sales process management.

Business process Flow Chart — Event-Driven Process chain (EPC) diagrams

Event-Driven Process chain Diagrams for improvement throughout an organisation. Best software for Process Flow Diagram. The Event-driven Process Chain (EPC) Diagrams allows managers to plan processes and resources.

Process Flow Chart

A Process Flow Chart is a type of flowchart which is mostly used in industrial, chemical and process engineering for illustrating high-level processes, major plant processes and not shows minor details. ConceptDraw PRO diagramming and vector drawing software extended with Flowcharts Solution from the "Diagrams" Area of ConceptDraw Solution Park is the best way to create Process Flow Chart and other types of flowcharts.

Cross Functional Flowchart Symbols

The excellent possibility to create attractive Cross Functional Flowcharts for step-by-step visualization the operations of a business process flow of any degree of detailing is offered by ConceptDraw’s Cross-Functional Flowcharts solution. The extensive selection of commonly used vector cross functional flowchart symbols allow you to demonstrate the document flow in organization, to represent each team member’s responsibilities and how processes get shared or transferred between different teams and departments.