Garrett IA Diagrams with ConceptDraw PRO
Garrett IA diagrams are used at development of Internet-resources, in particulars at projecting of interactions of web-resource elements. The diagram of information architecture of the web resource which is constructed correctly with necessary details presents to developers the resource in comprehensible and visual way.HelpDesk
Event-driven Process Chain (EPC) Diagram Software
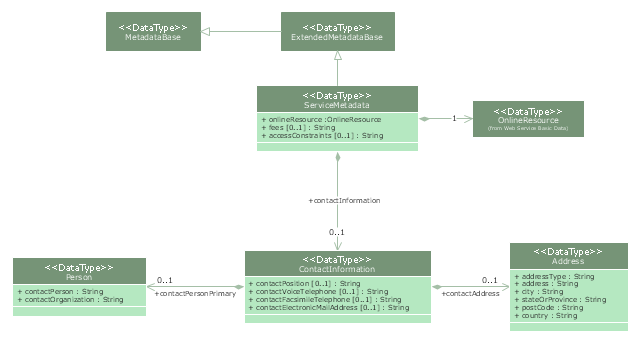
An EPC diagram is a type of flowchart used in business process analysis. It shows different business processes through various work flows. The workflows are shown as processes and events that are related to different executes and tasks that allow business workflow to be completed. An EPC diagram shows different business processes through various workflows. The workflows are seen as functions and events that are connected by different teams or people, as well as tasks that allow business processes to be executed. The best thing about this type of enterprise modelling is that creating an EPC diagram is quick and simple as long as you have the proper tool. One of the main usages of the EPC diagrams is in the modelling, analyzing and re-engineering of business processes. With the use of the flowchart, businesses are able to see inefficiencies in the processes and modify to make them more productive. Event-driven process chain diagrams are also used to configure an enterprise resource pla"Metadata is "data about data". The term is ambiguous, as it is used for two fundamentally different concepts (types). Structural metadata is about the design and specification of data structures and is more properly called "data about the containers of data"; descriptive metadata, on the other hand, is about individual instances of application data, the data content.
Metadata are traditionally found in the card catalogs of libraries. As information has become increasingly digital, metadata are also used to describe digital data using metadata standards specific to a particular discipline. By describing the contents and context of data files, the quality of the original data/ files is greatly increased. For example, a webpage may include metadata specifying what language it is written in, what tools were used to create it, and where to go for more on the subject, allowing browsers to automatically improve the experience of users." [Metadata. Wikipedia]
The UML class diagram example "Metadata information model" was created using the ConceptDraw PRO diagramming and vector drawing software extended with the Rapid UML solution from the Software Development area of ConceptDraw Solution Park.
Use Case Diagrams technology with ConceptDraw PRO
Use case diagrams are used at the development of software and systems for definition of functional system requirements or system of systems. Use case diagram presents the consecution of object’s actions (user’s or system’s) which are executed for reaching the definite result.IDEF3 Standard
Use Case Diagrams technology. IDEF3 Standard is intended for description and further analysis of technological processes of an enterprise. Using IDEF3 standard it is possible to examine and model scenarios of technological processes.HelpDesk
How to Create an Entity-Relationship Diagram Using ConceptDraw Solution Park
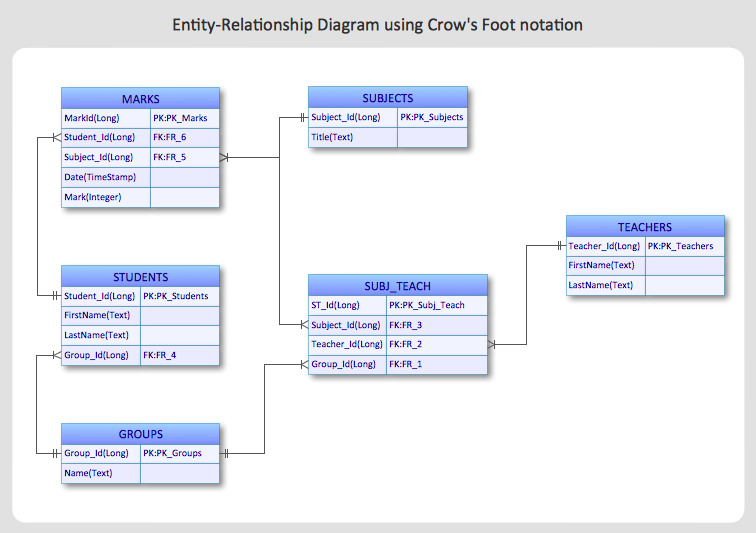
An entity-relationship diagram (ERD)is used in a database modeling process. ERD diagram shows a graphical representation of objects or concepts within an information system and their relationships.The ability to describe a database using the Entity-Relationship model is delivered by the ConceptDraw ERD solution.- 4 Level pyramid model diagram - Information systems types | 5 Level ...
- Explain Information System In An Enterprise With The Help Of Flow
- UML class diagram - Metadata information model | How to create a ...
- Gane Sarson Diagram | Accounting Information Systems Flowchart ...
- Describe Component Of Information System With Diagram In Details
- Using Diagrams Describe The Operating System And Information
- Chart Of Management Information System With Diagram
- Describe Management Information System With Pyramid
- Describe An Organisation Chart Using A Well Illustrated Diagram
- Pyramid Diagram | 4 Level pyramid model diagram - Information ...
- How to Create Flowcharts for an Accounting Information System ...
- Using A Triangular Pyramid Explain The Information Flow To And
- Pyramid Diagram | Process Flowchart | Pyramid Diagram | Explain ...
- Explain The Diagrammatic Illustration Of Information System Search
- Describe Various Levles Of Managemet And Levels Of Information
- Describe And Eplain The Flow Chart Of Information In Such
- With A Diagram Describe An Order Card
- With The Aid Of A Diagram Describe A System
- Explain Developing Information System With Diagram


