Map Infographic Design
ConceptDraw collection of vector elements for infographics design.Subway infographic design elements - software tools
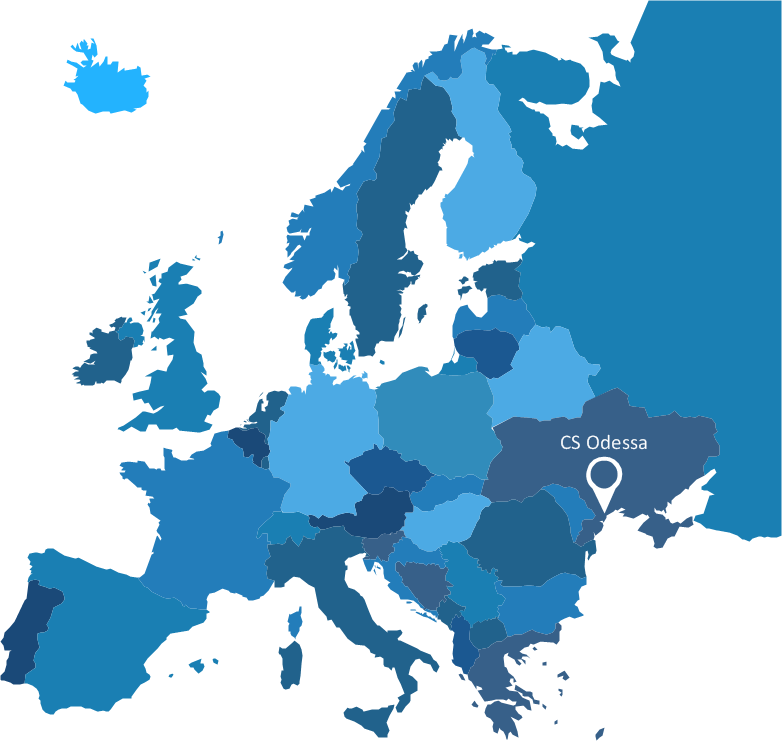
Subway infographic design elements of MetroMap and ConceptDraw software tools.Spatial infographics Design Elements: Continental Map
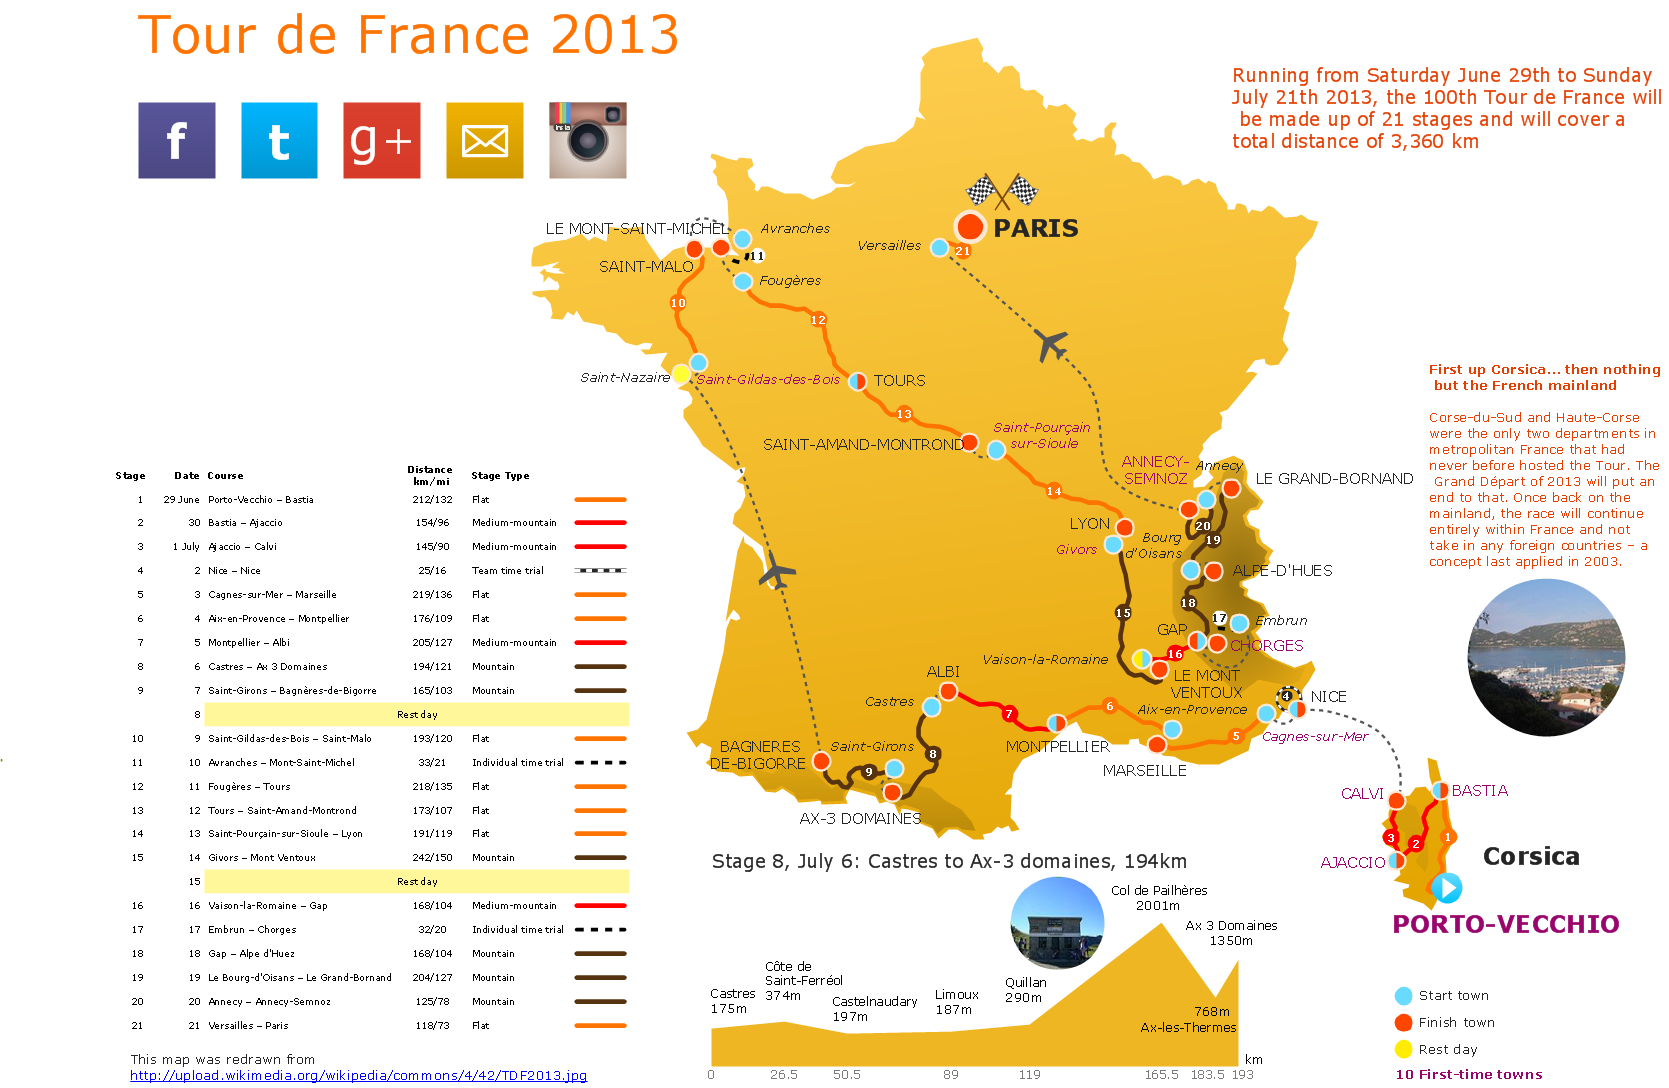
ConceptDraw PRO is a software for making infographics illustrations. You can work with various components to build really impressive and easy-to-understand infographics design.Spatial infographics Design Elements: Location Map
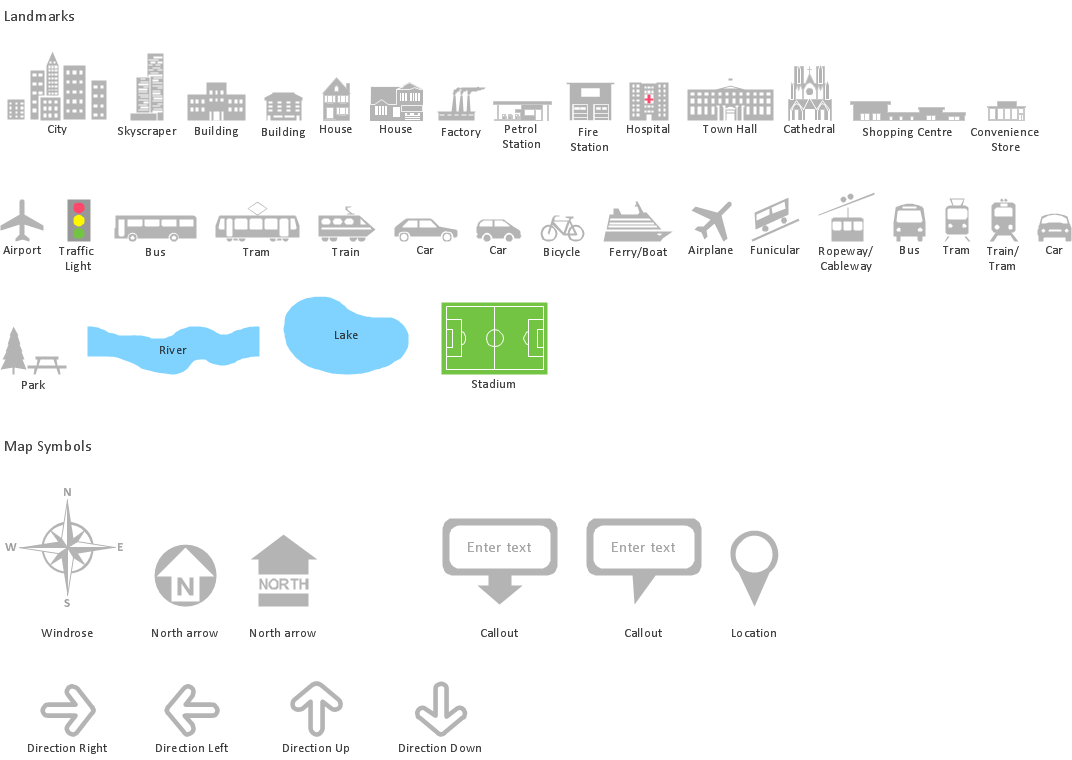
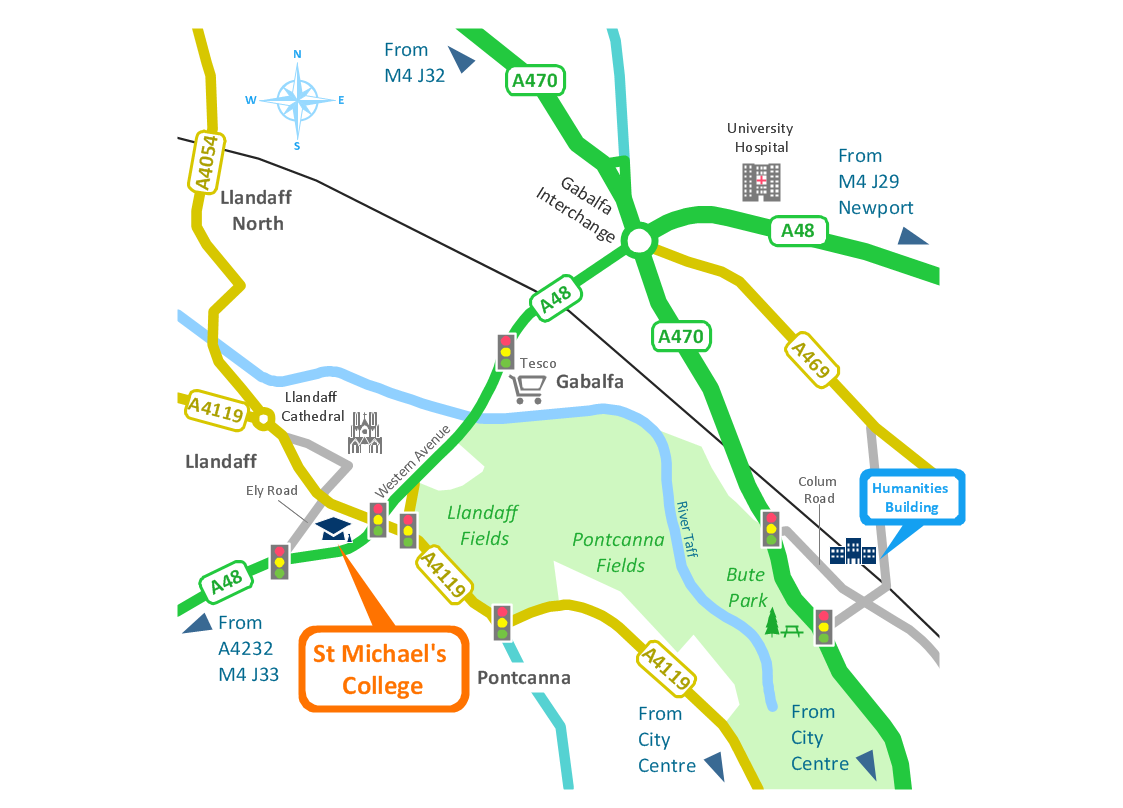
Infographic Design Elements for visually present various geographically distributed information.Spatial infographics Design Elements: Transport Map
Do you like infographics and data visualization? Creating infographics is super-easy with ConceptDraw.Best Tool for Infographic Construction
ConceptDraw is a best data visualization tool that will allow everyone to create rich infographics and visualizations quickly and easily.How to Create a Powerful Infographic When You do not Have a Designer
Create a powerful infographic, become inspired by the people with ConceptDraw.Map Infographic Tool
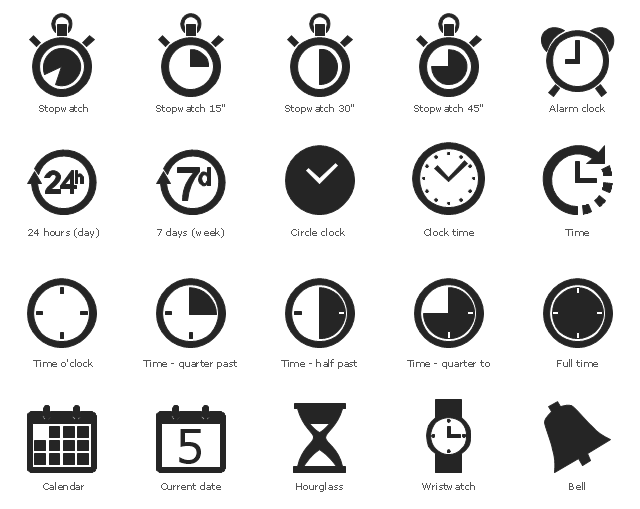
ConceptDraw is a data visualization tool, which can help you to create a map infographics. Anyone can do this, it's that easy!The vector stencils library "Time and clock pictograms" contains 20 time pictograms: clocks, calendars, day, week, bell, alarm clock, hourglass, wristwatch, and time intervals symbols.
Use it to create temporal infographic, illustrations and diagrams.
The pictograms example "Design elements - Time and clock pictograms" was created using the ConceptDraw PRO diagramming and vector drawing software extended with the Pictorial Infographic solution from the area "What is infographics" in ConceptDraw Solution Park.
 What are Infographic Area
Solutions of the area What is Infographics from ConceptDraw Solution Park collect templates, samples and vector stencils libraries with design elements for the drawing information graphics.
Winter Sports. Using Winter Sports Design Elements Producing Infographics
The Winter Sports solution from Sport Area of ConceptDraw Solution Park contains winter sports pictogram you may use illustrating any kind of material about Olympic Games or any other sport competitions.Design a Soccer (Football) Field
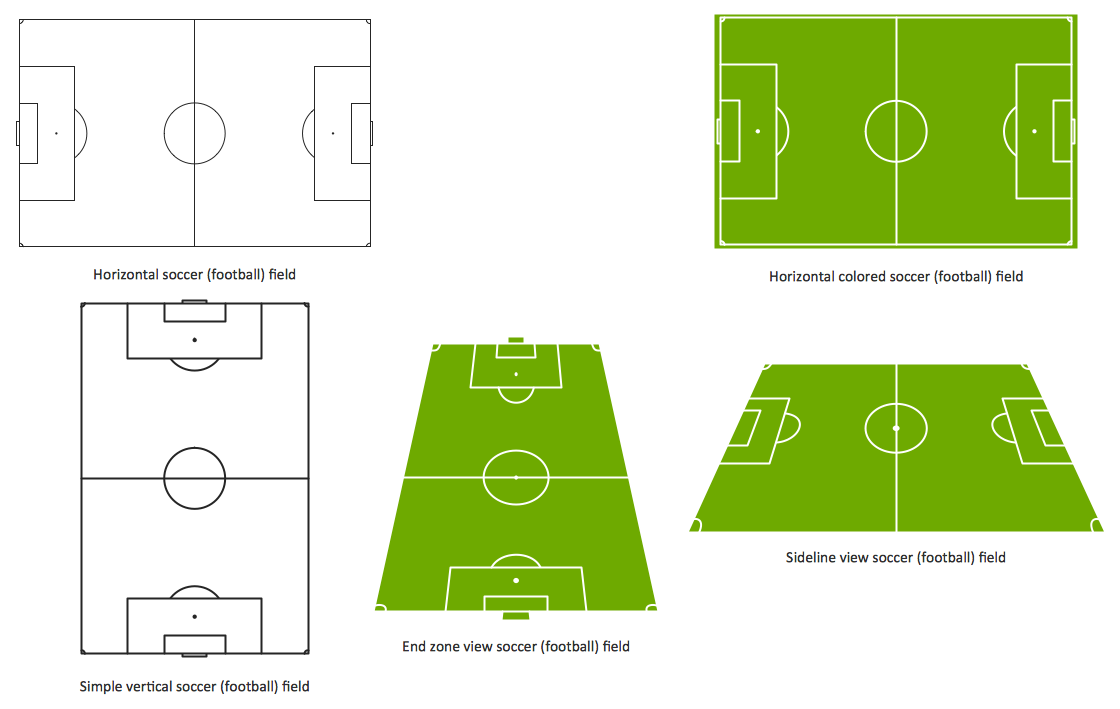
The Soccer (Football) Fields library from the Soccer solution from the Sport area of ConceptDraw Solution Park provides a complete set of predesigned fields: horizontal and vertical located, colored or not, end zone view soccer field.
 ConceptDraw Solution Park
ConceptDraw Solution Park collects graphic extensions, examples and learning materials
HelpDesk
How to Make a Web Page from Infographics in ConceptDraw PRO
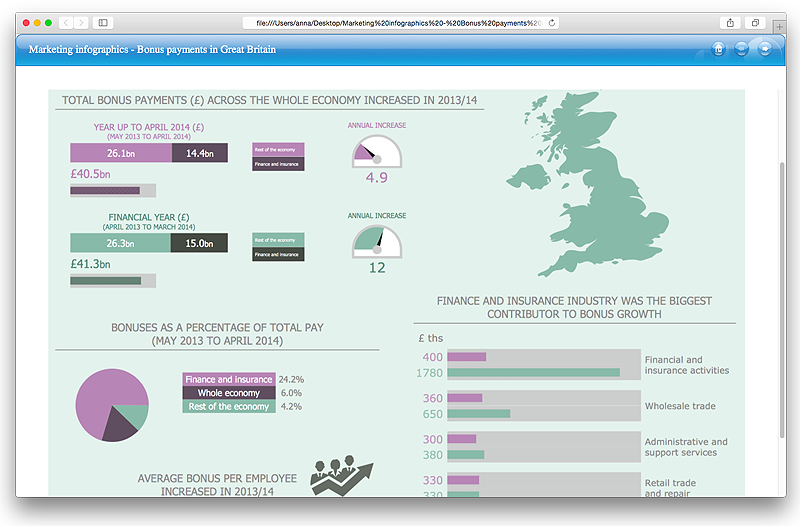
Create your own original marketing illustrations and infographics, presentation slides, website, and blog pages using ConceptDraw PRO.Design Pictorial Infographics. Design Infographics
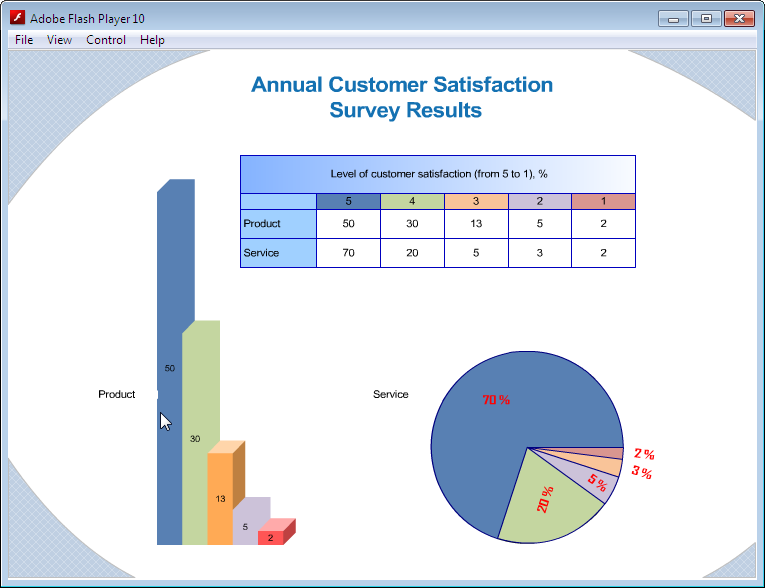
In the course of recent decades data visualization went through significant development and has become an indispensable tool of journalism, business intelligence and science. The way visual information may be conveyed is not limited simply to static or dynamic representation, it can also be interactive. Infographics can be conditionally divided into several general levels. Primarily, this is level of visualization of information, its interpretation and association on any ground. Second level can be defined as a visualization of knowledge, depiction of thoughts and ideas in the form of images or diagrams. Finally, the level of data visualization, which processes data arrays in charts, enabling the information to be more clearly perceived. You can also identify the main approaches to the creation of infographics: exploratory and narrative. Exploratory method insists on minimalist design in favor of data precision without unnecessary details and is common for scientific researches and anaHelpDesk
How to Use ConceptDraw Infographic in Presentations, Documents, and Publications
Exporting, embedding, and pasting as a picture are the ways you can use to add ConceptDraw drawings to presentations, documents, and publications.The vector stencils library "Shopping pictograms" contains 20 shopping symbols.
Use it to draw your infographics.
The example "Design elements - Shopping pictograms" was created using the ConceptDraw PRO diagramming and vector drawing software extended with the Pictorial Infographic solution from the area "What is infographics" in ConceptDraw Solution Park.
Use it to draw your infographics.
The example "Design elements - Shopping pictograms" was created using the ConceptDraw PRO diagramming and vector drawing software extended with the Pictorial Infographic solution from the area "What is infographics" in ConceptDraw Solution Park.
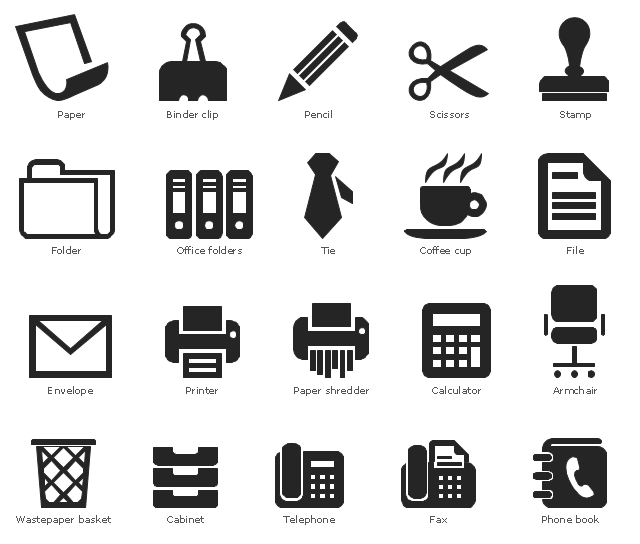
The vector stencils library "Office pictograms" contains 20 office pictograms.
Use it to draw your infographics.
The example "Design elements - Office pictograms" was created using the ConceptDraw PRO diagramming and vector drawing software extended with the Pictorial Infographic solution from the area "What is infographics" in ConceptDraw Solution Park.
Use it to draw your infographics.
The example "Design elements - Office pictograms" was created using the ConceptDraw PRO diagramming and vector drawing software extended with the Pictorial Infographic solution from the area "What is infographics" in ConceptDraw Solution Park.
- How to draw Metro Map style infographics? (London) | Infographic ...
- Map Infographic Design | Spatial infographics Design Elements ...
- Infographic design elements, software tools Subway and Metro style ...
- Spatial Infographics | Map Infographic Design | Spatial infographics ...
- Subway infographic design elements - software tools ...
- Subway infographic design elements - software tools | Infographic ...
- Transportation Infographics | Spatial infographics Design Elements ...
- Map Infographic Creator | Spatial infographics Design Elements ...
- Map Infographic Creator | Spatial infographics Design Elements ...
- How to draw Metro Map style infographics? (New York) | Infographic ...
- Infographic design elements, software tools Subway and Metro style ...
- Infographic design elements, software tools Subway and Metro style ...
- Map Infographic Design
- Subway infographic design elements - software tools | Map ...
- Spatial infographics Design Elements: Continental Map | Map ...
- AWS icons 2.0 | Illustration Area | Infographic design elements ...
- Map Infographic Design | Spatial Infographics | Map Infographic Tool |
- Illustration Area | Audio and Video Connectors | Infographic design ...
- Value Stream Mapping - Design Elements | Subway infographic ...
- Map Infographic Creator | How to draw Metro Map style infographics ...
