 ConceptDraw Solution Park
ConceptDraw Solution Park collects graphic extensions, examples and learning materials
Bubble diagrams in Landscape Design with ConceptDraw DIAGRAM
Bubble Diagrams are the charts with a bubble presentation of data with obligatory consideration of bubble's sizes. They are analogs of Mind Maps and find their application at many fields, and even in landscape design. At this case the bubbles are applied to illustrate the arrangement of different areas of future landscape design, such as lawns, flowerbeds, playgrounds, pools, recreation areas, etc. Bubble Diagram helps to see instantly the whole project, it is easy for design and quite informative, in most cases it reflects all needed information. Often Bubble Diagram is used as a draft for the future landscape project, on the first stage of its design, and in case of approval of chosen design concept is created advanced detailed landscape plan with specification of plants and used materials. Creation of Bubble Diagrams for landscape in ConceptDraw DIAGRAM software is an easy task thanks to the Bubble Diagrams solution from "Diagrams" area. You can use the ready scanned location plan as the base or create it easy using the special ConceptDraw libraries and templates.
 Office Layout Plans
Office layouts and office plans are a special category of building plans and are often an obligatory requirement for precise and correct construction, design and exploitation office premises and business buildings. Designers and architects strive to make office plans and office floor plans simple and accurate, but at the same time unique, elegant, creative, and even extraordinary to easily increase the effectiveness of the work while attracting a large number of clients.
 Bar Graphs
The Bar Graphs solution enhances ConceptDraw DIAGRAM functionality with templates, numerous professional-looking samples, and a library of vector stencils for drawing different types of Bar Graphs, such as Simple Bar Graph, Double Bar Graph, Divided Bar Graph, Horizontal Bar Graph, Vertical Bar Graph, and Column Bar Chart.
HelpDesk
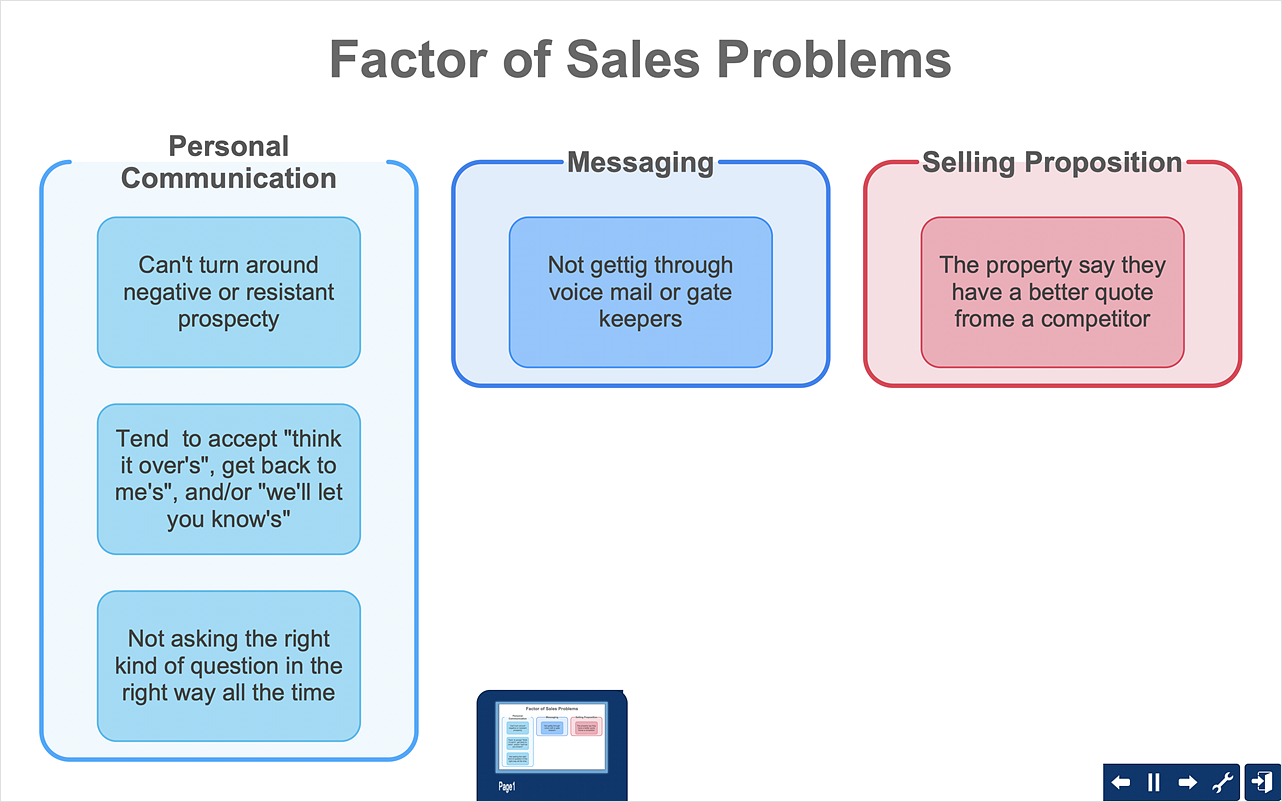
How To Create an Affinity Diagram Using Solutions
Affinity diagram is designed to prepare the data for further analysis of the cause-effect relationships.The Affinity diagram shows the structure of large, complex factors that have an influence on a problem, and then divides them up into a smaller and simpler structure. We recommend using a mind map for Brainstorming and collecting the factors affecting the problem. The ability to create an Affinity diagram from a mind map is supported by the ConceptDraw Seven Management and Planning Tools solution.- Bar Graph | Design elements - Marketing charts | Composition ...
- Design elements - Composition charts and indicators | Composition ...
- Cafe and Restaurant Floor Plan | Sport Field Plans | Plant Layout ...
- Bar Diagrams for Problem Solving. Create space science bar charts ...
- Ideas For A Communication Flow Chart
- Building Drawing Software for Design Office Layout Plan | Interior ...
- Reflected Ceiling Plans | Design elements - Registers, drills and ...
- Divided Bar Diagrams | Bar Graphs | What is a Dashboard Area ...
- Ceiling Design Ideas | Reflected Ceiling Plan | Reflected Ceiling ...
- Safety and Security | ConceptDraw Solution Park | Comparison ...
- Ceiling Design Ideas | Ceiling Ideas For Living Room | Ceiling Ideas ...
- Restaurant Floor Plans Samples | Interior Design Registers, Drills ...
- Food Court | F&B | Health Food | Mind Map Designs Using Fruits
- Stakeholder Onion Diagrams | Stakeholder Mapping Tool | PM ...
- How to Create a Reflected Ceiling Floor Plan | Ceiling Design Ideas ...
- Home Office Ideas | Office Layout Plans | How To use Architect ...
- Building Drawing Software for Design Office Layout Plan | Office ...
- Process Flowchart | Cafe Design Ideas | Bubble diagrams in ...
- Home Office Design Ideas
- Building Drawing Software for Design Seating Plan | Building ...

