Physical LAN Diagrams illustrate the communication schemes of Local Area Networks, the physical network connection of computers and networks arrangement on the small areas - at homes, offices, and other buildings. ConceptDraw DIAGRAM is a perfect network diagramming software with samples and examples of WAN and LAN Diagrams, templates and collection of network components libraries.
Computer Network Diagrams Solution for ConceptDraw DIAGRAM Mac and Windows is ideal for IT professionals, network engineers and network designers who need to visualize network architecture, to document LANs physical structure and arrangement, to draw Local Area Network (LAN) diagrams and schematics, WAN diagrams, physical office network diagrams and topologies, wiring drawings, etc. You can design all them easy using the predesigned vector objects of computers and computer network devices, hardware devices, peripheral devices, external digital devices, internet and logical symbols, and many other stencils from the Computer Network Diagrams libraries.
ConceptDraw DIAGRAM offers a powerful and easy-to-use solution for those who looking for a Visio alternative for Mac. It is a world-class diagramming platform with dynamic presentation power.
Entity Relationship Diagram (aka ER Diagram, E-R Diagram, ERD) is a time-tested and widespread software development and software engineering method for data modeling, illustrating the logical structure of databases and system design. For ERDs construction are used three basic elements: entities, attributes, and relationships. Chen's notation for ERD supposes the use of rectangles (boxes) to represent entities and diamonds to depict relationships between first-class objects. This notation is popular when creating conceptual data models of information systems. Another standardized notation for ER diagrams is Crow's foot notation.
ConceptDraw DIAGRAM as a powerful Entity Relationship Diagram software engineering provides the tools of Entity-Relationship Diagram (ERD) solution from Software Development area of ConceptDraw Solution Park for instantly describing databases using ERDs of Crow’s Foot and Chen’s notations. Use the predesigned vector elements for both these notations from 2 libraries included to Entity-Relationship Diagram (ERD) solution.
Competitor analysis is a first and obligatory step in elaboration the proper corporate marketing strategy and creating sustainable competitive advantage. Use powerful opportunities of numerous solutions from ConceptDraw Solution Park for designing illustrative diagrams, charts, matrices which are necessary for effective competitor analysis.
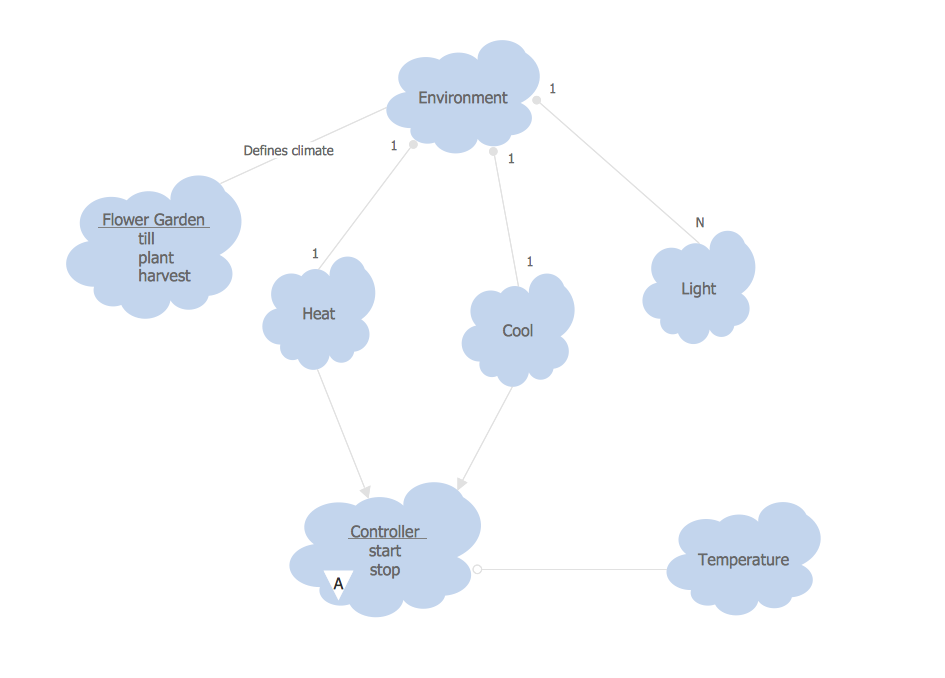
This sample shows the Booch OOD diagram of the environment. The Booch method (developed by Grady Booch) is an object modeling language and methodology used in software engineering.
This sample was created in ConceptDraw DIAGRAM diagramming and vector drawing software using the Rapid UML Solution from the Software Development area of ConceptDraw Solution Park.
The Venn diagram example below shows sustainable development at the confluence of three constituent parts.
Create your Venn diagrams for problem solving in environmental social science using the ConceptDraw DIAGRAM diagramming and vector drawing software extended with the Venn Diagrams solution from the area "Diagrams" of ConceptDraw Solution Park.
UML Deployment diagram describes the hardware used in system implementations and the execution environments and artifacts deployed on the hardware.
ConceptDraw has 393 vector stencils in the 13 libraries that helps you to start using software for designing your own UML Diagrams. You can use the appropriate stencils of UML notation from UML Deployment library.
This sample was created in ConceptDraw DIAGRAM diagramming and vector drawing software using the UML Class Diagram library of the Rapid UML Solution from the Software Development area of ConceptDraw Solution Park.
This sample describes the use of the classes, the generalization associations between them, the multiplicity of associations and constraints. Provided UML diagram is one of the examples set that are part of Rapid UML solution.
How do Fishbone diagrams solve manufacturing problems? Fishbone diagrams are successfully used in various fields of industries and manufacturing to analyze the set of possible causes and their effects. Fishbone diagram provides a process to clearly define the “Effect” and then puts you to thinking about the possible causes, based on the categories of common problems in manufacturing.
ConceptDraw DIAGRAM application extended with Fishbone Diagrams solution lets you construct Fishbone diagrams and represent globally recognized standards for manufacturing 6 Ms and 8 Ms.
Problems are obstacles and challenges that one should overcome to reach the goal. They are an inseparable part of any business, and the success of an enterprise often depends on ability to solve all problems effectively. The process of problem solving often uses rational approach, helping to find a suitable solution.
Using Fishbone Diagrams for Problem Solving is a productive and illustrative tool to identify the most important factors causing the trouble. ConceptDraw DIAGRAM extended with Fishbone Diagrams solution from the Management area of ConceptDraw Solution Park is a powerful tool for problem solving with Fishbone Ishikawa diagram graphic method.