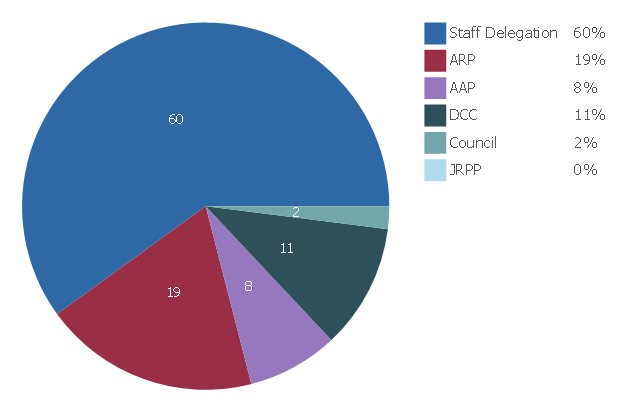
This percentage pie chart example is redesigned from the web page Building and development - How are Development Applications assessed - Determination (approval or rejection) from the Woollahra Municipal Council (New South Wales, Australia) website [www.woollahra.nsw.gov.au/ building_ and_ development/ how_ we_ assess_ your_ da/ determination_ approval_ or_ rejection ].
This file is available under the Creative Commons Attribution-ShareAlike 3.0 Unported License [creativecommons.org/ licenses/ by-sa/ 3.0/ ].
"A pie chart (or a circle graph) is a circular chart divided into sectors, illustrating numerical proportion. In a pie chart, the arc length of each sector (and consequently its central angle and area), is proportional to the quantity it represents. While it is named for its resemblance to a pie which has been sliced, there are variations on the way it can be presented. ...
Pie charts are very widely used in the business world and the mass media." [Pie chart. Wikipedia]
The percentage pie chart example "Development Assessment determination" was created using the ConceptDraw PRO diagramming and vector drawing software extended with the Pie Charts solution of the Graphs and Charts area in ConceptDraw Solution Park.
www.conceptdraw.com/ solution-park/ charts-pie
Percentage pie chart
- Percentage Pie Chart. Pie Chart Examples - Conceptdraw.com
- Pie Chart Examples and Templates - Conceptdraw.com
- Geo Map - Australia
- Pie Chart Examples and Templates | Pie Chart Software | How to ...
- Pie chart template
- Arrow pie chart template | Pie chart - Domestic energy consumption ...
- Pie Chart Examples and Templates | Pie Chart Software | Pie chart ...
- Basic Diagramming | Best Software to Draw Diagrams | Visual ...
- Pie Chart Examples and Templates | Arrow pie chart template ...
- Pie Chart Examples | Pie chart template | Pie Charts |
- Pie Chart Software | Pie Chart Examples | How to Create a Pie Chart |
- Pie Chart Examples | How to Create a Pie Chart | Pie chart template |
- Geo Map - Australia - New South Wales - Conceptdraw.com
- Arrow circle chart template | Design elements - Pie charts | Pie Chart ...
- Pie Chart Software | Pie Chart Word Template. Pie Chart Examples ...
- Pie Chart Software | Pie Chart Examples and Templates | Pie Chart ...
- How to Create a Pie Chart | Pie Chart Software | Pie Charts |
- Pie Charts | Pie Chart Software | Pie Chart Examples and Templates |
- Social Media Response | How to Draw a Flowchart | Copying ...
- Service-goods continuum diagram | Pyramid Chart Examples ...
- ERD | Entity Relationship Diagrams, ERD Software for Mac and Win
- Flowchart | Basic Flowchart Symbols and Meaning
- Flowchart | Flowchart Design - Symbols, Shapes, Stencils and Icons
- Flowchart | Flow Chart Symbols
- Electrical | Electrical Drawing - Wiring and Circuits Schematics
- Flowchart | Common Flowchart Symbols
- Flowchart | Common Flowchart Symbols