Process Flowchart


Example of DFD for Online Store (Data Flow Diagram)


Context Diagram Template

This template shows the Context Diagram. It was created in ConceptDraw DIAGRAM diagramming and vector drawing software using the Block Diagrams Solution from the “Diagrams” area of ConceptDraw Solution Park. The context diagram graphically identifies the system. external factors, and relations between them. It’s a high level view of the system. The context diagrams are widely used in software engineering and systems engineering for designing the systems that process the information.
Management Tools — Total Quality Management

Social Media Response Management DFD Charts - software tools


Types of Flowchart - Overview


Flow chart Example. Warehouse Flowchart


Structured Systems Analysis and Design Method (SSADM) with ConceptDraw DIAGRAM

Bar Diagrams for Problem Solving. Create event management bar charts with Bar Graphs Solution

Total Quality Management with ConceptDraw

Types of Flowcharts

Value Stream Diagram

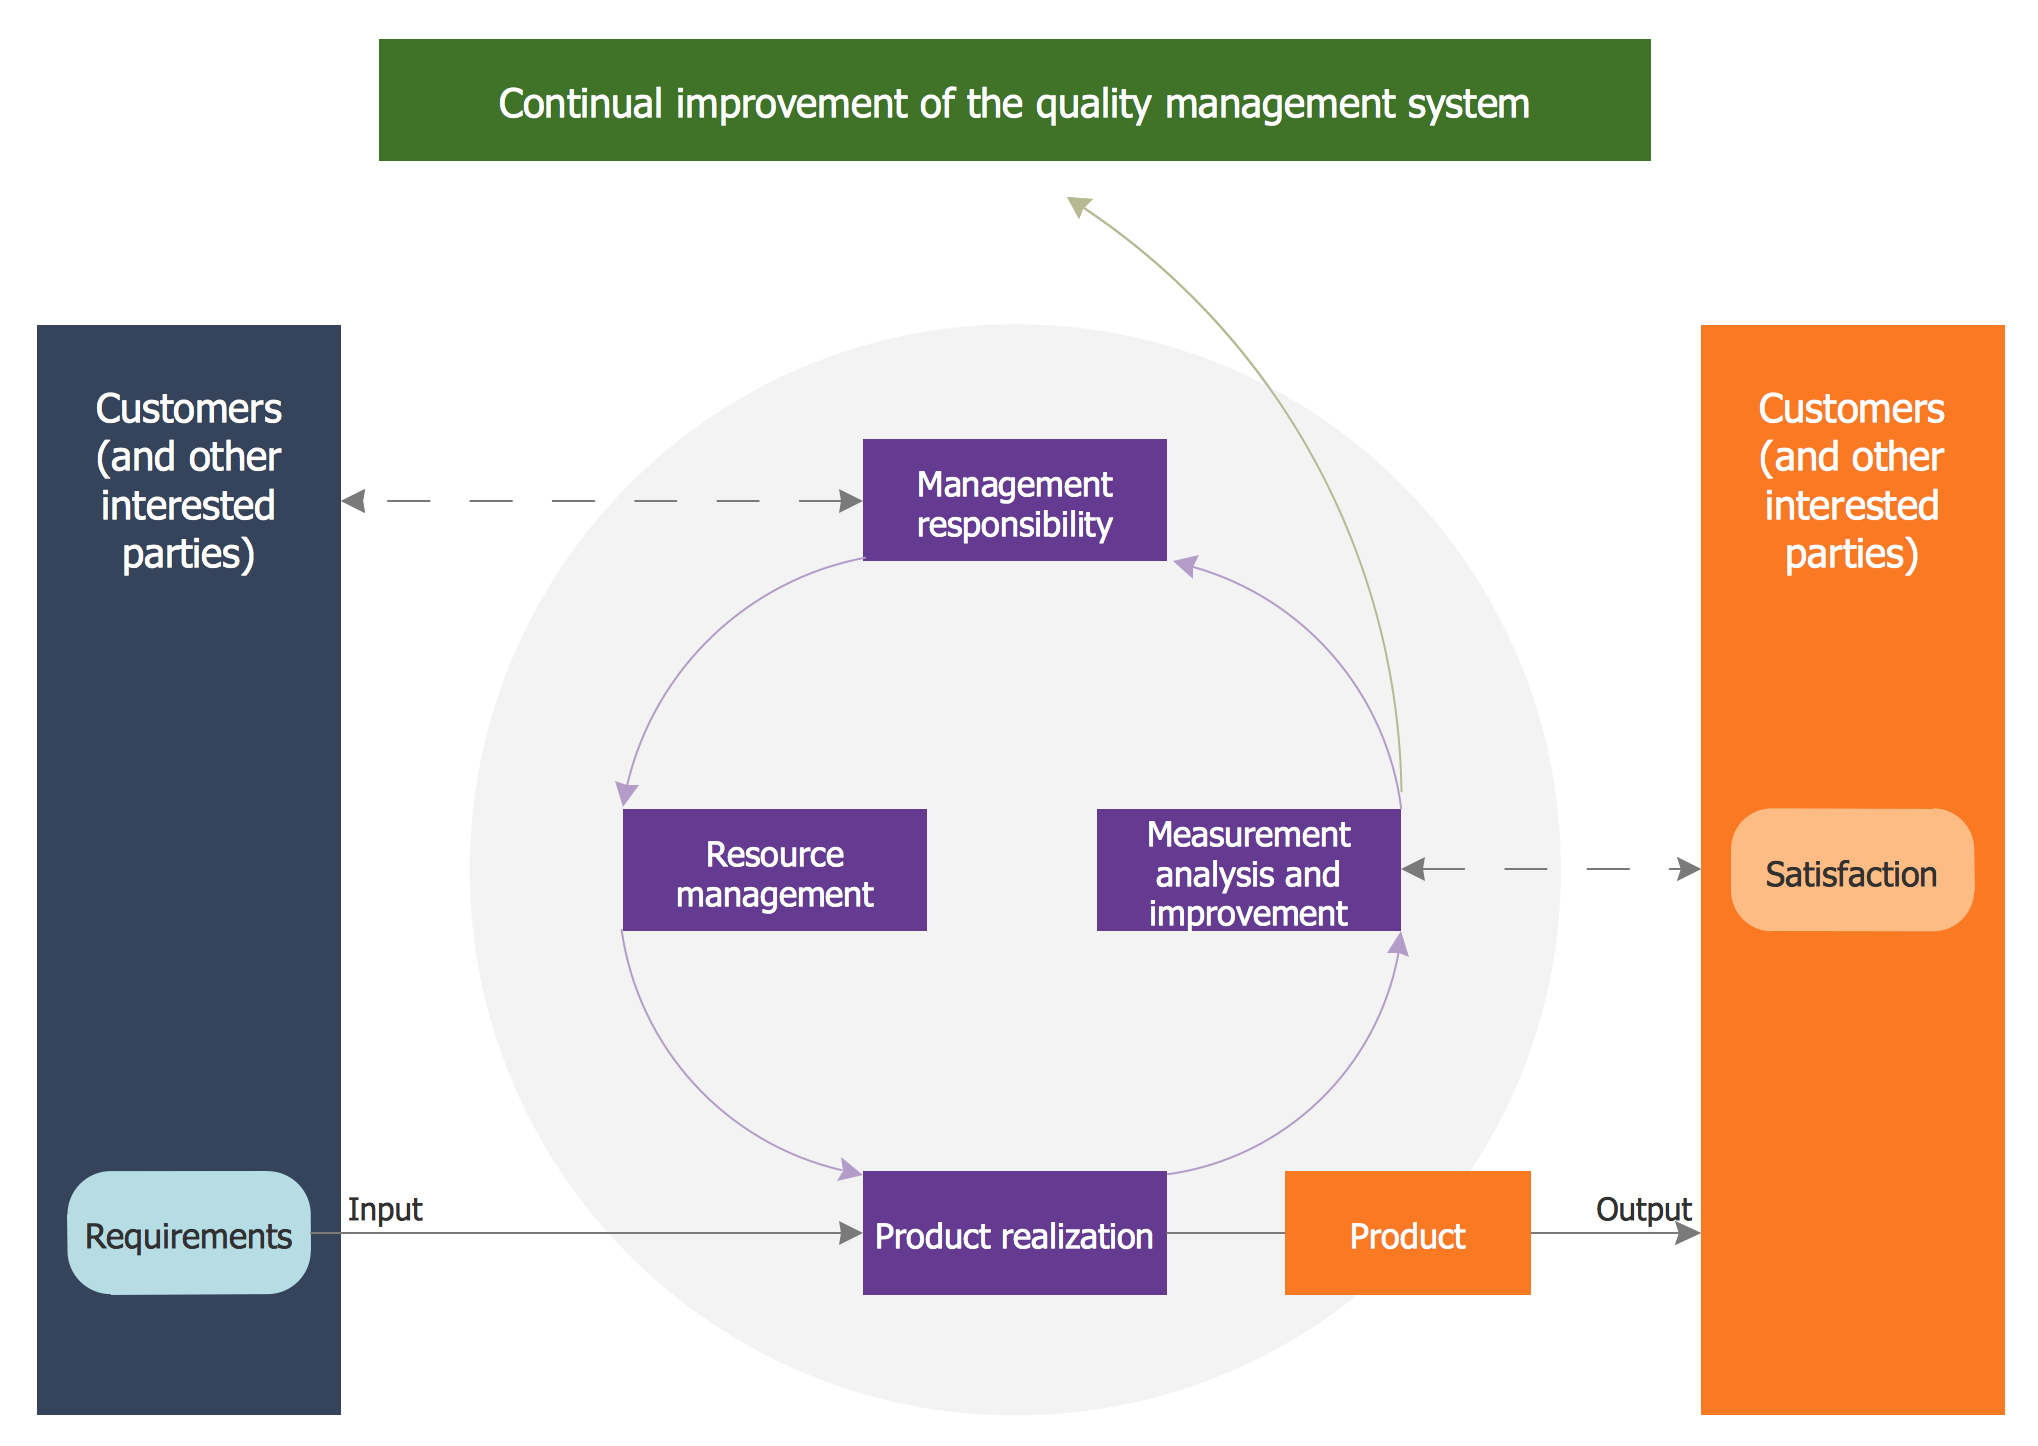
Quality Management System
Gane Sarson Diagram

IDEF0 standard with ConceptDraw DIAGRAM

- Dfd Diagram Of Industries Management
- Data Flow Diagram In Industrial Engineering
- Process Flowchart | Data Flow Diagram Model | Manufacturing 8 Ms ...
- Process Flowchart | Total Quality Management Value | Data Flow ...
- Bar Diagrams for Problem Solving. Create event management bar ...
- Project Management Area | Seven Management and Planning Tools ...
- Data Flow Diagram Symbols. DFD Library | Types of Flowchart ...
- Data Flow Diagrams (DFD) | Accounting Flowcharts | Aerospace and ...
- Process Flowchart | How to Create Flowcharts for an Accounting ...
- Flow Diagram For Sales Management System
- Structured Systems Analysis and Design Method (SSADM) with ...
- Industrial Management Explain With Block Diagram
- Basic Flowchart Symbols and Meaning | Data Flow Diagram ...
- Flow Chart For Collection Management System
- Flow Chart Of Database Transport Management System
- Operation Process Chart Industrial Engineering
- System Process Diagram
- Data Flow Diagram For A Farm Management System
- Data Flow Diagram For University Management System
- Er Diagram For Production And Distribution Management System