Example of DFD for Online Store (Data Flow Diagram)
Data Flow Diagram (DFD) is a methodology of graphical structural analysis and information systems design, which describes the sources external in respect to the system, recipients of data, logical functions, data flows and data stores that are accessed. DFDs allow to identify relationships between various system's components and are effectively used in business analysis and information systems analysis. They are useful for system’s high-level details modeling, to show how the input data are transformed to output results via the sequence of functional transformations. For description of DFD diagrams are uses two notations — Yourdon and Gane-Sarson, which differ in syntax. Online Store DFD example illustrates the Data Flow Diagram for online store, the interactions between Customers, Visitors, Sellers, depicts User databases and the flows of Website Information. ConceptDraw DIAGRAM enhanced with Data Flow Diagrams solution lets you to draw clear and simple example of DFD for Online Store using special libraries of predesigned DFD symbols.
Flowchart
The Flowcharts are widespread in various fields and include the multitude of types. They are dedicated to representation the algorithms, processes, workflows of any complexity in a clear and intuitive format. The Flowcharts are commonly used in software development as a visual tool for illustration algorithms and logic of computer programs, in business for illustration business scenarios, in education, and so on. For drawing the Flowchart are used the special object blocks, among them rectangle or box used to represent an activity or step, rounded box or oval to depict Start / End, diamond to represent the decision point (involves the branching yes/no), circle used to represent the point of connection, parallelogram to represent the Input / Output, and some others. With ConceptDraw DIAGRAM including Flowcharts solution it is easy to create professional-looking Flowchart diagrams of any complexity and any degree of detailing. Succeed in drawing the Flowcharts using quick-start templates, predesigned samples and extensive libraries of ready-made flowchart symbols, blocks and icons.Android GUI
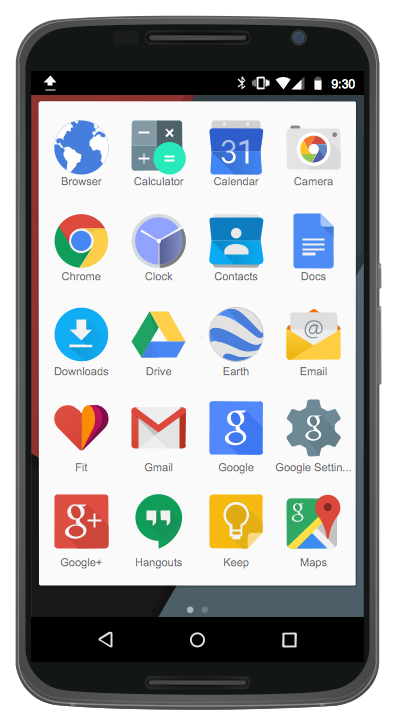
Android is an operating system based on the Linux kernel and developed by Google for smartphones, tablet computers, electronic books, netbooks, smartbooks, digital players, watches, game consoles, TV and other devices. ConceptDraw DIAGRAM extended with Android User Interface Solution from the Software Development Area is a powerful software with extensive drawing tools which can help you to build the intelligible, attractive and easy for perception Android GUI for your application.- Data Flow Diagram For Laundry Management System
- Dfd For Salon Management
- Simple Flow Chart | Example of DFD for Online Store ( Data Flow ...
- Simple Flow Chart | Example of DFD for Online Store ( Data Flow ...
- Dfd Of Laundry System
- Simple Flow Chart | Example of DFD for Online Store ( Data Flow ...
- Simple Flow Chart | Example of DFD for Online Store ( Data Flow ...
- Dfd For Catering Management System
- Sample Dfd Of Catering Management System
- Hotel Management System Context Diagram Images
- Types of Flowcharts | Sales Process Management | Basic Flowchart ...
- Data Flow Dia Gram For Military Management System
- Process Flowchart | HR Management Software | Types of Flowchart ...
- What Is Er Diagram Sample Project Management System
- Basic Flowchart Symbols and Meaning | Example of DFD for Online ...
- What Are Laundry Processes Diagrams
- Catering Management System Activity Diagram
- Sales Process Flowchart. Flowchart Examples | Sales Process ...
- Basic Flowchart Symbols and Meaning | ERD Symbols and ...
- Er Diagram Of Kitchen Managment System


