Structured Systems Analysis and Design Method (SSADM) with ConceptDraw DIAGRAM

Types of Flowcharts


Examples Flowchart

ConceptDraw DIAGRAM diagramming and vector drawing software provides the unique Flowcharts Solution from the "Diagrams" Area of ConceptDraw Solution Park with variety of vector objects libraries and collection of examples Flowchart. Each example flowchart included in Flowcharts solution is a real help in drawing process, it can be the good base or perfect source of inspiration.
Fruit Art
Bar Diagrams for Problem Solving. Create economics and financial bar charts with Bar Graphs Solution

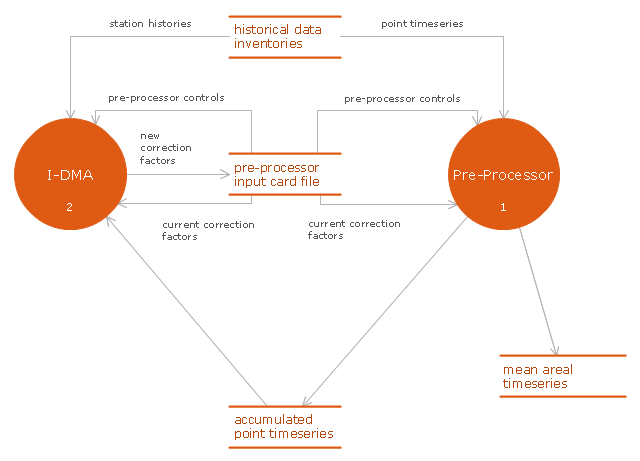
This DFD sample was created on the base of figure illustrating the "Interactive Double Mass Analysis. User's Guide" from the website of the Office of Hydrologic Development of the National Weather Service (NWS) of the National Oceanic and Atmospheric Administration (NOAA).
"Double mass analysis is a technique commonly employed to determine corrections to hydrometeorological data to account for changes in data collection procedures or other local conditions. The changes may result from a variety of things including changes in instrumentation, changes in observation procedures, or changes in gage location or surrounding conditions. The purpose of this Interactive Double Mass Analysis (IDMA) tool is to provide an effective and efficient way for users to perform consistency checking using double mass analysis and to produce the correction factors that are used in subsequent processing by NWSRFS preprocessor tools to account for any discovered inconsistencies.
Computations of mean areal time series for use in calibration and ESP have traditionally been made using the appropriate preprocessing software (MAP, PXPP, MAT etc.). The preprocessors have traditionally taken point time series as input and have provided facilities for estimation of missing data, and for consistency checking and correction in addition to the mean areal computations. The IDMA tool has been designed to run in conjunction with the preprocessors in an iterative fashion. It performs the consistency checking function, leaving the estimation, correction and mean areal computations to the preprocessors. ...
As shown in Figure ... the preprocessor software generates a data file that contains accumulated data values for each station and the associated group base, as well as flags indicating whether the values were estimated or not. This data file along with the input card file used by the preprocessor are used by the IDMA tool. The IDMA tool then allows the user to perform consistency checks and to calculate correction factors. The correction factors are then returned so that the preprocessors can perform the corrections, re-estimate missing data and perform the mean areal computations. Note that there is an interdependence between the estimation of missing values in the preprocessors and the correction factors computed in the IDMA and so there needs to be iteration between the two processes until the user is satisfied that an appropriate balance has been reached."
[nws.noaa.gov/ oh/ hrl/ idma/ users_ guide/ html/ dma_ overview.php]
The example "Interaction between IDMA and preprocessor" was created using the ConceptDraw PRO diagramming and vector drawing software extended with the Data Flow Diagrams solution from the Software Development area of ConceptDraw Solution Park.
DFD
Sales Process Map

Create Flowchart

Flowchart Definition

Sample Project Flowchart. Flowchart Examples


- Organogram Of National Park
- Difference Between Data Flow Diagram And Architecture Diagram
- Example of DFD for Online Store ( Data Flow Diagram ) DFD ...
- Structured Systems Analysis and Design Method (SSADM) with ...
- Types of Flowcharts | National Service Scheme Dataflow Diagram
- Gane Sarson Diagram | DFD , Gane-Sarson notation - Template ...
- Pyramid Diagram | Pyramid Chart Examples | PM Presentations ...
- Data Flow Diagram Process | Structured Systems Analysis and ...
- Level 0 Dfd For Hotel Management System
- Example of DFD for Online Store ( Data Flow Diagram ) DFD ...