Social Media Flowchart Symbols
Social media is a popular view of mass communication which allows people, companies and organizations create, share, discover, modify, access, comment, discuss and exchange information through the Internet. Social Media Response solution for ConceptDraw PRO provides collection of 10 libraries with diversity of predesigned vector social media flowchart symbols for fast and easy creating interactive Social Media Flowcharts, Response Charts and Action Mind Maps.Bar Chart Template for Word
All these bar chart templates are included in the Bar Graphs solution. You can quickly rework these bar graph templates into your own charts by simply changing displayed data, title and legend texts.Donut Chart Templates
These donut chart templates was designed using ConceptDraw PRO diagramming and vector drawing software extended with Pie Charts solution from Graphs and Charts area of ConceptDraw Solution Park. All these donut chart templates are included in the Pie Charts solution. You can quickly rework these examples into your own charts by simply changing displayed data, title and legend texts.Column Chart Template
Column chart templates from ConceptDraw collection can help you find the best visual depiction for you data. You can easily modify column chart templates according to data you want to visualize.Pie Chart Examples and Templates
A pie chart or a circle graph is a circular chart divided into sectors, illustrating numerical proportion. In a pie chart, the arc length of each sector and consequently its central angle and area, is proportional to the quantity it represents. Pie chart examples and templates created using ConceptDraw PRO software helps you get closer with pie charts and find pie chart examples suite your needs.
 AWS Architecture Diagrams
The flexible AWS cloud solutions will help you to create reliable applications with a high level of scaling in the AWS cloud, to run your applications and accelerate their work on the level of security. Besides AWS resources are available worldwide and yo
Example Basic Flowchart. Flowchart Examples
This sample shows the Flowchart that displays the process of the achievement the consensus, in other words solving for the acceptable solution. This Flowchart has start point. The rectangles on it represent the steps of the process and are connected with arrows that show the sequence of the actions. The diamonds with yes/no shows the decisions. The Flowcharts are widely used in marketing, business, analytics, government, politics, engineering, architecture, science, manufacturing, administration, etc.How to Create a Pie Chart
Create a Pie Chart with ConceptDraw software quickly and easily. The simple tutorial helps you learn how to create a pie chart.Samples of Flowcharting
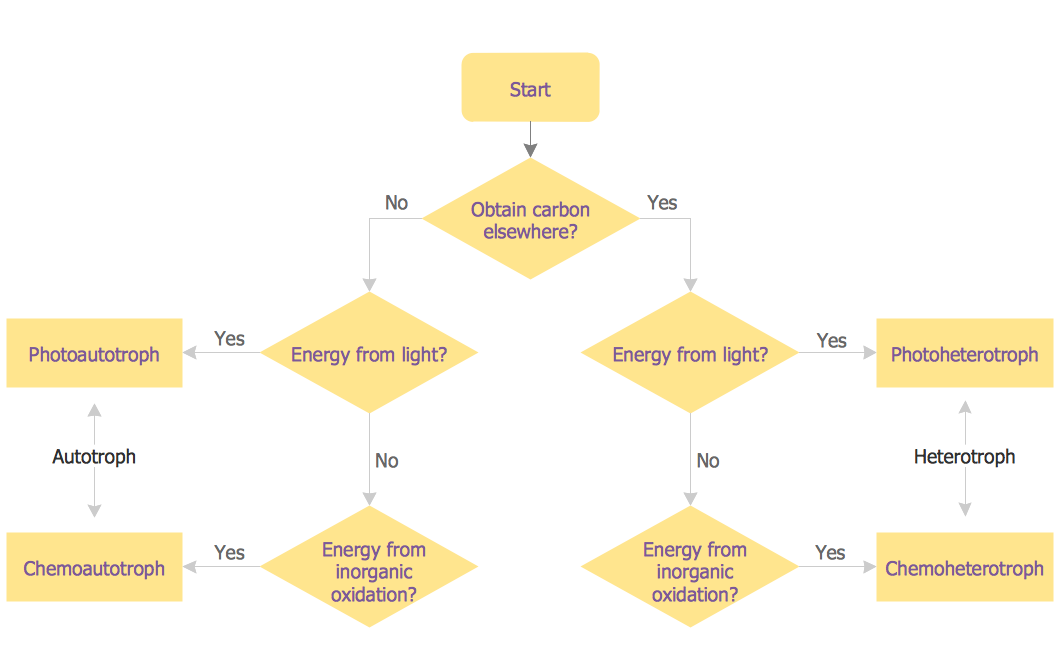
This sample shows the Flowchart for determine is a species heterotroph or autotroph, or a subtype. This diagram has start point and end points. The diamonds on the Flowchart represent the decisions. The Flowcharts are widely used in science, analytics, government, politics, business, engineering, architecture, marketing, manufacturing, administration, etc.Basic Flowchart Images. Flowchart Examples
This sample was created in ConceptDraw PRO diagramming and vector drawing software using the Flowcharts solution from the What is a Diagram area of ConceptDraw Solution Park. This sample shows the Flowchart that displays the procedures of 2PP (two-party preferred) voting and counting the voters. The two-party-preferred vote is the result of the elections that was distributed to the final two parties.Flowchart of Products. Flowchart Examples
This sample shows the Flowchart of the Sustainment and Disposal. A Flowchart is a graphically representation of the process that step-by-step lead to the solution the problem. The geometric figures on the Flowchart represent the steps of the process and are connected with arrows that show the sequence of the actions. The Flowcharts are widely used in engineering, architecture, science, analytics, government, politics, business, marketing, manufacturing, administration, etc.
 Audit Flowcharts
Audit flowcharts solution extends ConceptDraw PRO software with templates, samples and library of vector stencils for drawing the audit and fiscal flow charts.
- Flow chart Example. Warehouse Flowchart | Example of DFD for ...
- How to Create a Social Media DFD Flowchart | Pie Chart Word ...
- How to Create a Social Media DFD Flowchart | Flowchart Marketing ...
- How to Create a Social Media DFD Flowchart | How to Connect ...
- How to Create a Social Media DFD Flowchart | Social Media ...
- How to Create a Social Media DFD Flowchart | Create Response ...
- Social Media Flowchart Symbols | How to Connect Social Media ...
- How to Create a Social Media DFD Flowchart | UML Use Case ...
- Business Tools Perceptual Mapping | How to Create a Social Media ...
- How to Create a Social Media DFD Flowchart | Online store social ...
- How to Create a Social Media DFD Flowchart | Top 5 Android Flow ...
- Process Flowchart | Example of Organizational Chart | How to ...
- Cross-Functional Flowchart | How to Create a Social Media DFD ...
- How to Connect Social Media DFD Flowchart with Action Maps ...
- Flowchart Marketing Process. Flowchart Examples | Marketing Flow ...
- Data Flow Diagrams ( DFD ) | Example of DFD for Online Store ( Data ...
- Process Flowchart | How to Create a Social Media DFD Flowchart ...
- Processing Flow Chart | Pie Chart Word Template. Pie Chart ...
- How to Create a Social Media DFD Flowchart | How to Create ...
- Copying Service Process Flowchart. Flowchart Examples | How to ...


