Data Flow Diagram (DFD)
A Data Flow Diagram (DFD) illustrates the flow of data through an information system, visualizes how the information is handled in terms of inputs and outputs, how the data enter to system and leave it. It is effective to use a Data Flow Diagram for creation the system's overview, to show the system's scope and boundaries. There are two different types of notations for DFDs: Yourdon-Coad and Gane-Sarson, which differ in visual representations for processes, data flow, data stores, external entities, etc. Thus, for example the processes are depicted as circles in Yourdon-Coad notation and as rounded squares in Gane-Sarson notation. Gane-Sarson notation is usually used for visualization information systems and Yourdon-Coad - for system analysis and design. The Data Flow Diagrams solution included to Software Development area of ConceptDraw Solution Park offers a lot of DFD templates, samples and examples, libraries of vector stencils for construction without efforts the DFDs according to both Gane-Sarson and Yourdon-Coad notations.Basic Flowchart Symbols and Meaning
Flowcharts are the best for visually representation the business processes and the flow of a custom-order process through various departments within an organization. ConceptDraw PRO diagramming and vector drawing software extended with Flowcharts solution offers the full set of predesigned basic flowchart symbols which are gathered at two libraries: Flowchart and Flowcharts Rapid Draw. Among them are: process, terminator, decision, data, document, display, manual loop, and many other specific symbols. The meaning for each symbol offered by ConceptDraw gives the presentation about their proposed use in professional Flowcharts for business and technical processes, software algorithms, well-developed structures of web sites, Workflow diagrams, Process flow diagram and correlation in developing on-line instructional projects or business process system. Use of ready flow chart symbols in diagrams is incredibly useful - you need simply drag desired from the libraries to your document and arrange them in required order. There are a few serious alternatives to Visio for Mac, one of them is ConceptDraw PRO. It is one of the main contender with the most similar features and capabilities.
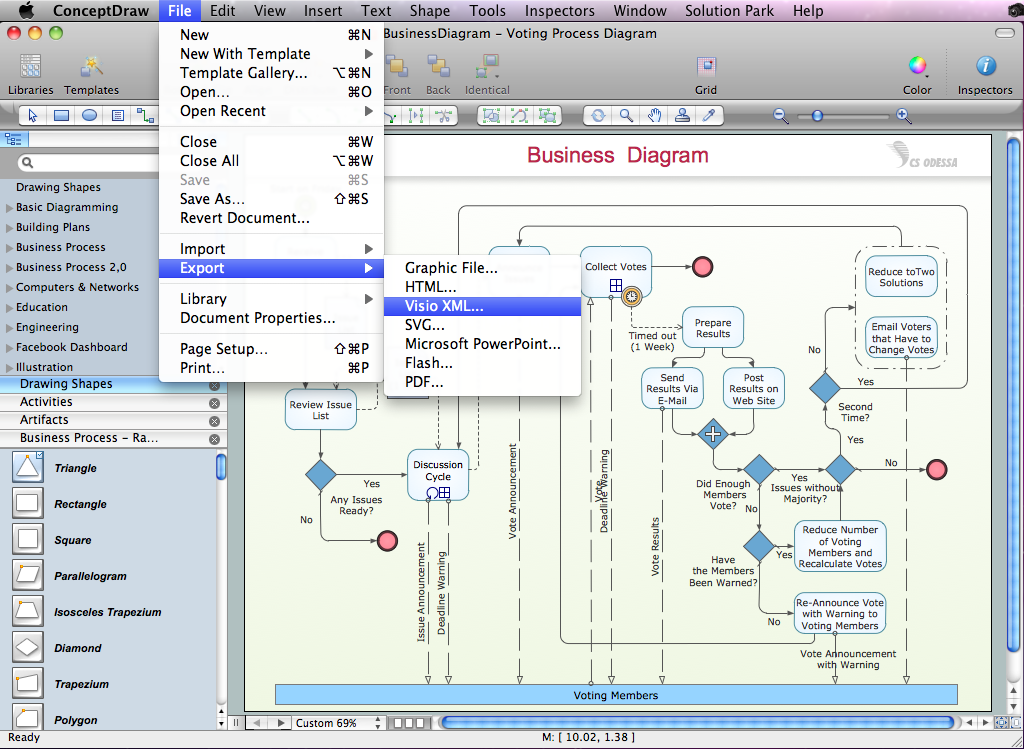
Export from ConceptDraw PRO Document to MS Visio® XML
Once you have created your document in ConceptDraw PRO and you want to share it with your colleagues and friends, who uses MS Visio on their computers, you can easily export your document using ConceptDraw PRO export to Visio XML files (VDX) feature. Now you can share your ConceptDraw documents with MS Visio users.
 Business Productivity Area
Business Productivity Solutions extend ConceptDraw products with tools for making presentations, conducting meetings, preparing documents, brainstorming, or building new strategies.
 Universal Diagramming Area
This area collects solutions for drawing diagrams, charts, graphs, matrices, geographic and road maps for education, science, engineering, business.
 Computer and Networks Area
The solutions from Computer and Networks Area of ConceptDraw Solution Park collect samples, templates and vector stencils libraries for drawing computer and network diagrams, schemes and technical drawings.
 Area Charts
Area Charts are used to display the cumulative totals over time using numbers or percentages; or to show trends over time among related attributes. The Area Chart is effective when comparing two or more quantities. Each series of data is typically represented with a different color, the use of color transparency in an object’s transparency shows overlapped areas and smaller areas hidden behind larger areas.
 Vehicular Networking
The Vehicular Networking solution extends the ConceptDraw PRO software functionality with specialized tools, wide variety of pre-made vector objects, collection of samples and templates in order to help network engineers design vehicular network diagrams for effective network engineering activity, visualize vehicular networks, develop smart transportation systems, design various types of vehicle network management diagrams, regional network diagrams, vehicular communication system diagrams, vehicular ad-hoc networks, vehicular delay-tolerant networks, and other network engineering schemes.
 Azure Architecture
Azure Architecture solution bundles into one handy tool everything you need to create effective Azure Architecture diagrams. It adds the extra value to versatile ConceptDraw PRO software and extends the users capabilities with comprehensive collection of Microsoft Azure themed graphics, logos, preset templates, wide array of predesigned vector symbols that covers the subjects such as Azure management, Azure storage, and Azure services, amongst others, and allow you to illustrate Azure Architecture diagrams at any degree of complexity, to present visually your Azure cloud system architecture with professional style, to design Azure cloud topology, to document Windows Azure Architecture and Azure Cloud System Architecture, to visualize the great abilities and work of Microsoft Azure Cloud System and Azure services.
- Excellent Job Solutions Dfd Dgram
- Data Flow Diagram
- Basic Flowchart Symbols and Meaning | Data Flow Diagram ...
- Software Job Opportunities In Graphical Representation
- Flow Chart of Marketing Analysis
- Business process diagram BPMN 1.2 - Hiring process | Business ...
- UML use case diagram - Banking system | Banking System | Data ...
- Man Power Agency Data Flow Diagram
- Business process diagram BPMN 1.2 - Hiring process | Hiring ...
- Draw Flowcharts with ConceptDraw | Use the Best FlowChart Tool ...
- Pyramid Diagram | Pyramid Diagram | Data Flow Diagram ( DFD ...
- Data Flow Diagram Model | UML Activity Diagram. Design Elements ...
- HR Flowcharts | HR Flowchart Symbols | Human Resource ...
- Bubble diagram - Employment policy direction | Best Diagramming ...
- Data Flow Diagrams | Process Flowchart | Visio Files and ...
- UML use case diagram - Banking system | Data Flow Diagrams ...
- Use the Best FlowChart Tool for the Job | Replacing engine oil ...
- Business Process Diagram | Business Process Modeling with ...
- Dfd Diagram In Visio
- Hiring process workflow | How to Create a HR Process Flowchart ...


