 Fishbone Diagram
Fishbone Diagrams solution extends ConceptDraw PRO software with templates, samples and library of vector stencils for drawing the Ishikawa diagrams for cause and effect analysis.
 Fishbone Diagrams
The Fishbone Diagrams solution extends ConceptDraw PRO v10 software with the ability to easily draw the Fishbone Diagrams (Ishikawa Diagrams) to clearly see the cause and effect analysis and also problem solving. The vector graphic diagrams produced using this solution can be used in whitepapers, presentations, datasheets, posters, and published technical material.
Mac Diagramming Software
ConceptDraw PRO software is the best Mac diagramming software for drawing any type of diagrams. Its rich set of samples and templates, and specific features to draw with great visual appeal on Mac OS X.Product Overview
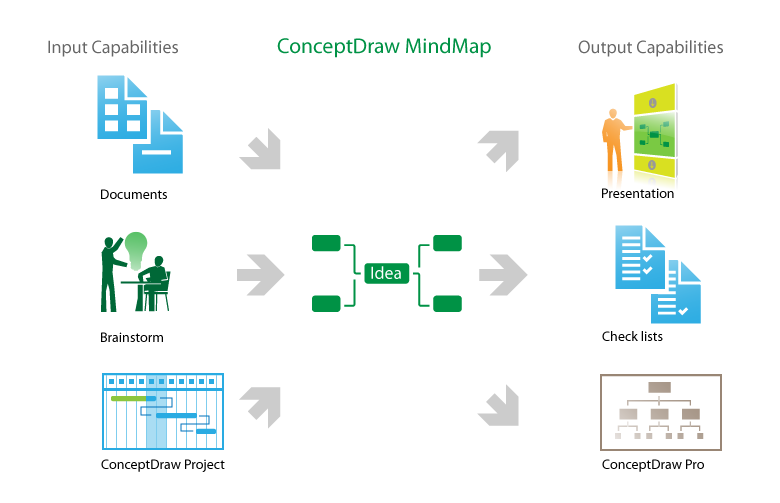
The role of ConceptDraw MINDMAP is to organize and plan idea development and communicate between process participants. Mind maps are convenient to prepare presentations for team and management and send task lists and related information.- Fishbone Diagrams | Fishbone Diagram | Cause and Effect ...
- Ishikawa Diagram Sales Example
- Cause and Effect Analysis | Cause and Effect Diagram | PROBLEM ...
- Fishbone Diagrams | Cause and Effect Analysis | Fishbone Diagram ...
- Fault Tree Analysis Man Machine Material Method Type Example
- Fishbone diagram - Causes of low -quality output | Fishbone ...
- Root cause analysis tree diagram - Template
- Fishbone diagram - Causes of low -quality output | Manufacturing 8 ...
- Cause and effect diagram - Increase in productivity | Business ...
- Fishbone Diagram Poor Quality Of Product
- Cause And Effect Relationship Sales
- Fishbone Diagrams | Fishbone diagram - Causes of low -quality ...
- Cause And Effect Diagram Poor Quality Education
- Ishikawa Diagram Process
- Fishbone Diagrams | Fishbone Diagram Problem Solving | Total ...
- Fishbone Diagram Problem Solving | Human Resource ...
- Fishbone Diagram | Using Fishbone Diagrams for Problem Solving ...
- Total Quality Management Value | Seven Basic Tools of Quality ...
- Cause and Effect Diagram | Cause and Effect Analysis - Fishbone ...

